DataOps Principle #8: Reflect (cont.)
“What gets measured gets done”… I’ve seen that message numerous times over my career and, along with DataOps, has influenced the way I look at and improve upon team performance. In the last blog article I explained Low-Code Coverage and detailed how we can log the underlying data it needs using Azure DevOps, PowerShell, and SharePoint Online. Now that we have the data, we need to extract it from SharePoint and transform it into something us mere mortals can measure as Low-Code Coverage…sounds like a job for Power BI!
DataOps Principle #8: Analytic teams should fine-tune their operational performance by self-reflecting, at regular intervals, on feedback provided by their customers, themselves, and operational statistics.
So, let’s start at the end so you can see the final product first:
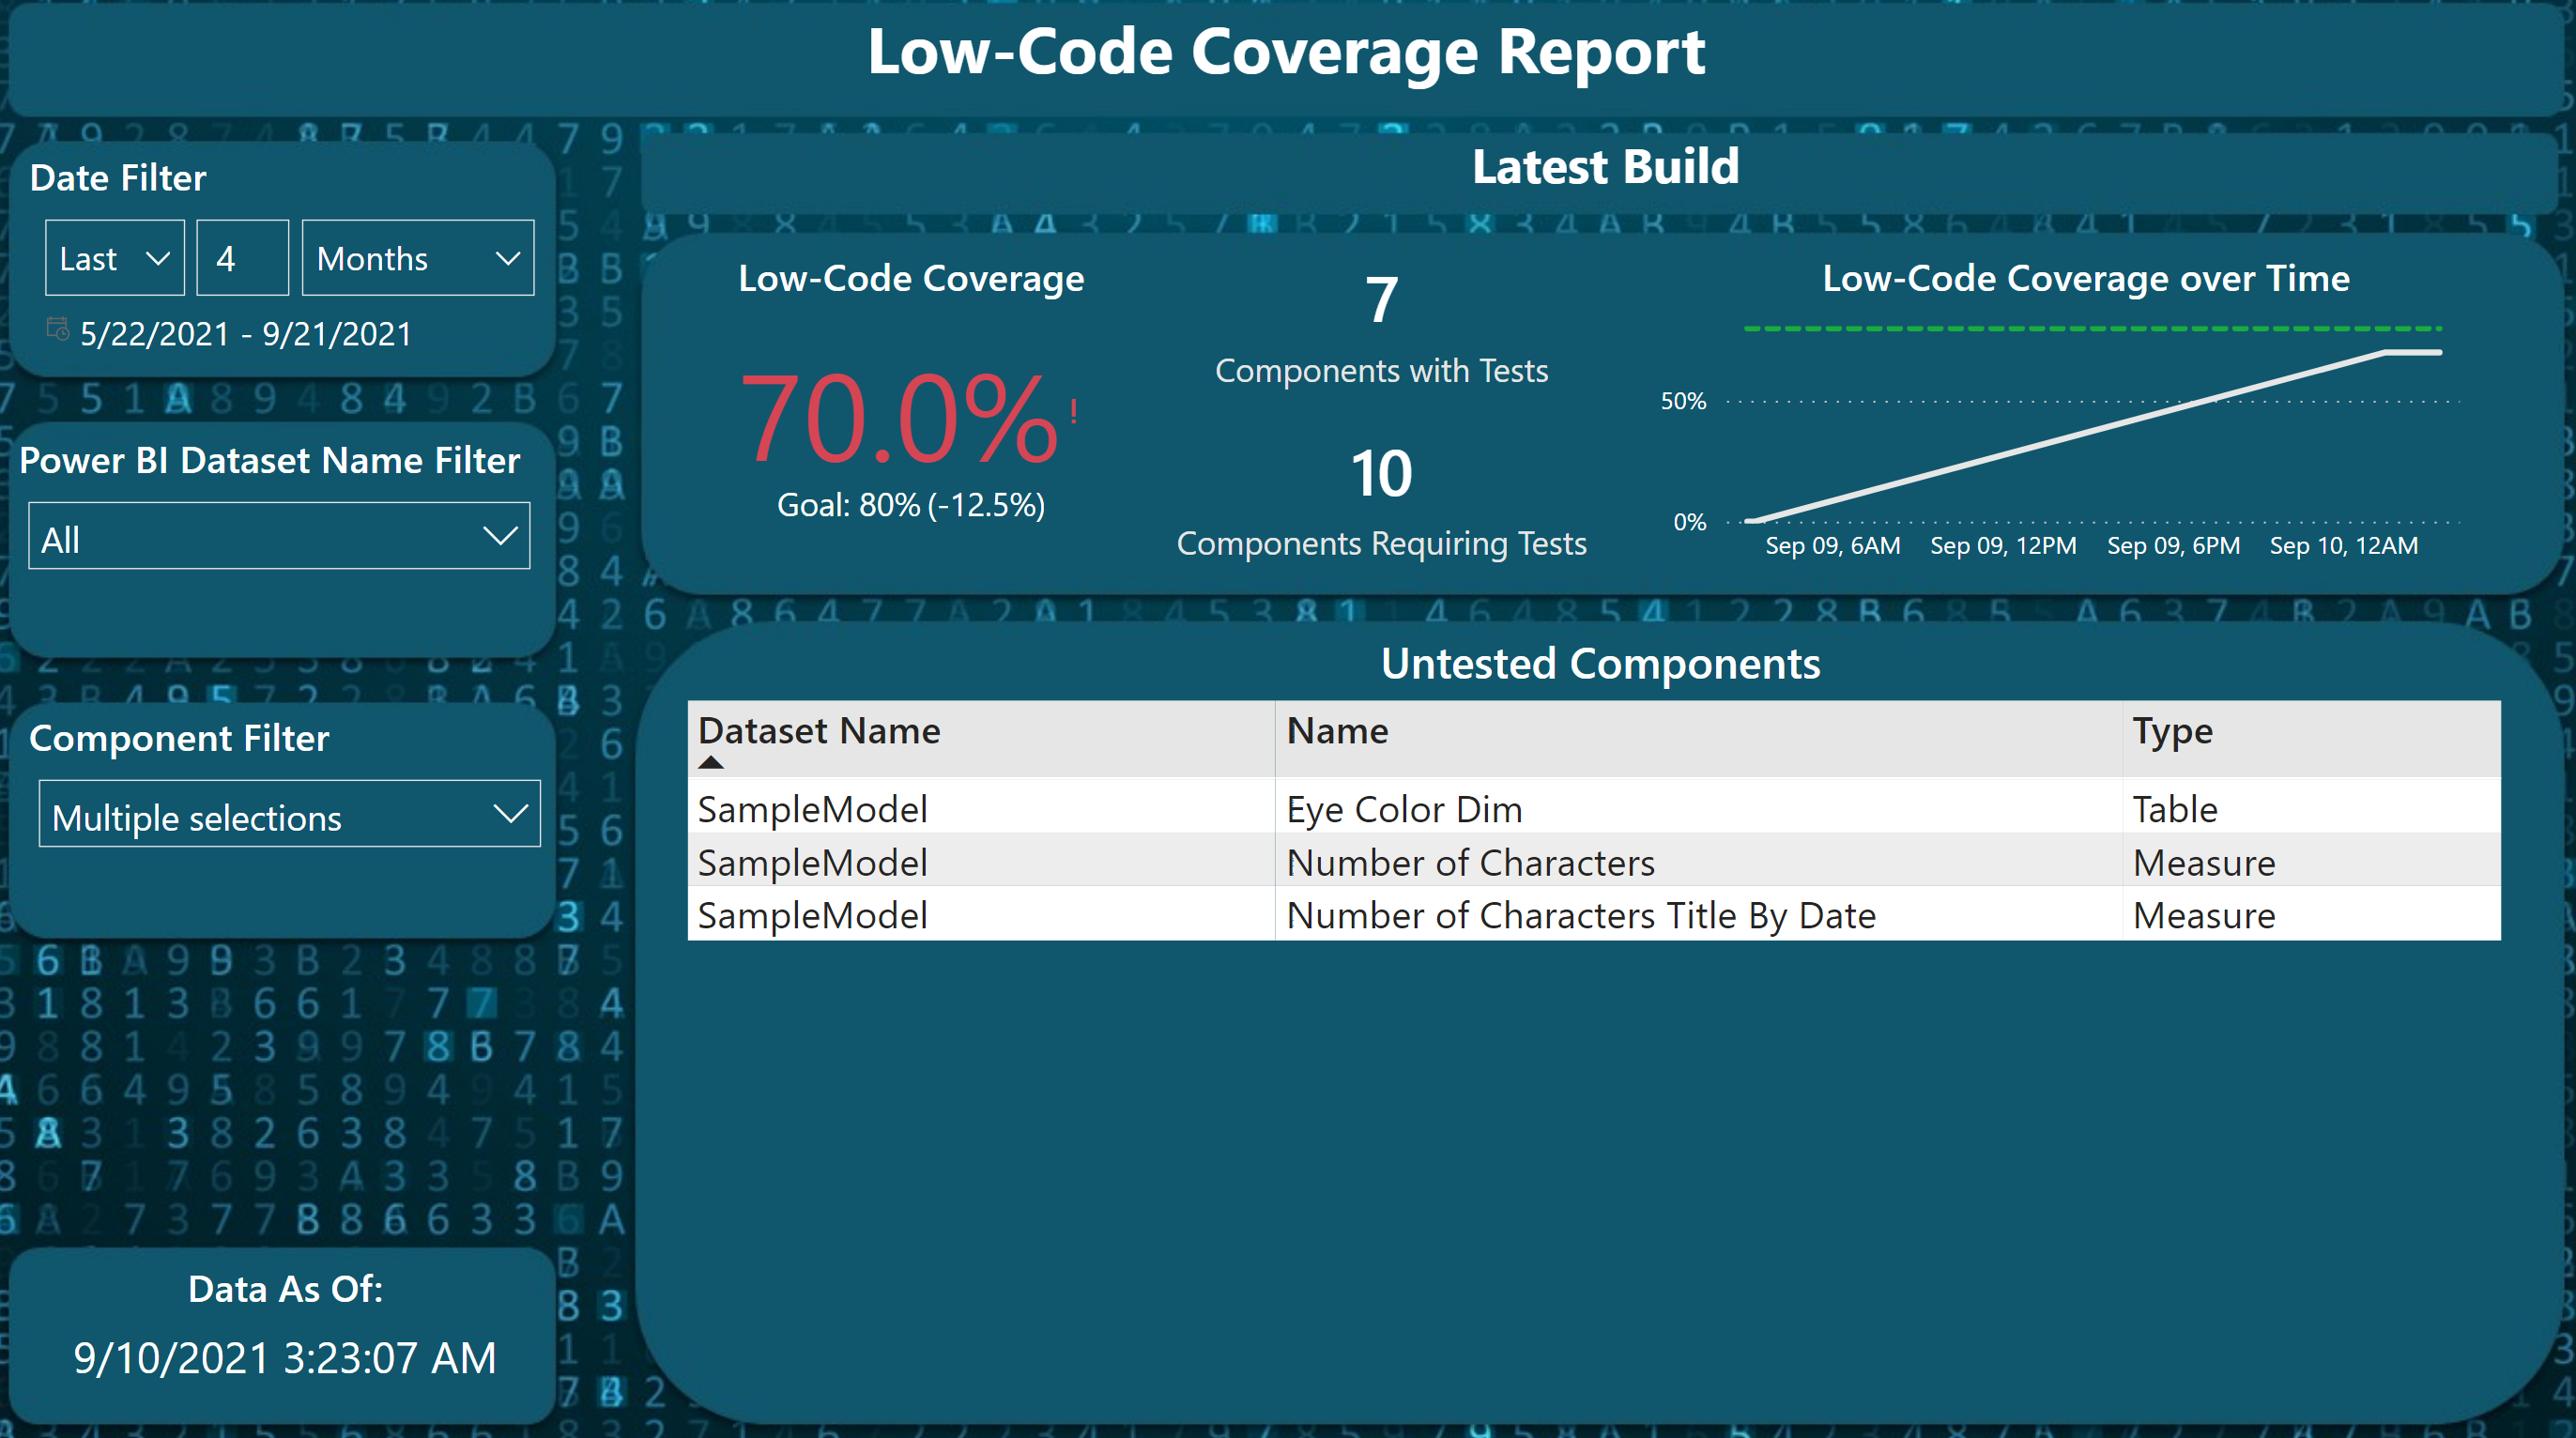 Figure 1 – Screenshot of the Low-Code Coverage Report
This type of report has allowed my teams to reflect on their testing and have a Low-Code Coverage goal to achieve. In the example above, that goal is 80% and you’ll notice that in this case the KPI reads 70% meaning we haven’t achieved the goal. The KPI is a DAX measure that is built by the two numbers that are displayed to the right of the KPI: Components with Tests (the numerator) and Components Requiring Tests (the denominator). Each is calculated through the following high-level steps:
Components Requiring Steps - Leveraging the Measure, Table, and Column data extracts from the Dynamic Management Views, Power Query parses the XML for each extract and combines them into one table. Each row in the table identifies the type of component, Table, Measure, or Calculated Column. It also contains a concatenated key that combines the build ID, dataset name, component name, and component type separated by a pipe character. With that schema, we can use a distinct count to calculate the denominator by build, or by dataset name.
Components with Tests - Now that we know the tables, measures, and calculated columns that need testing we can leverage the Calculation Dependencies extract to identify what components were used in the tests. Within Power Query, I parse the XML of the Calculation Dependencies and extract just the DAX measures representing the tests. To make it easier, I prefix the name of each test in the DevOps pipeline to distinguish the tests from other DAX measures. We then build the same concatenated key as we did for the denominator and then left join the denominator table with the numerator table. This allows us to identify the rows that have tests, those that don’t have tests, and build some custom columns to make it easier to calculate the numerator. As an aside to Microsoft, I would like to be able to merge tables using more than one column please, the concatenated key approach is getting a little old.
Alright so if you were not able to follow that, I loaded the Power BI template into GitHub, so you can review the step-by-step Power Query I used to build the dataset. If you do look in Power Query, I do want to point out the following:
1) SharePoint API Query – The out-of-the-box connector to SharePoint is slow, so you will see 4 functions that helps query SharePoint Online through the REST API. We can then just get the columns we need for the dataset and reduce the time to refresh the dataset.
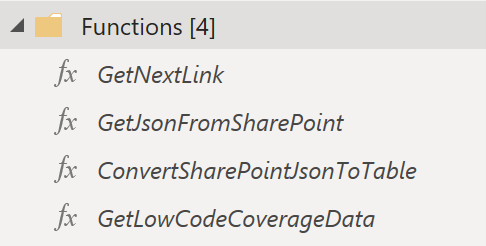 Figure 2 – Custom Power Query functions to get SharePoint data (faster)
2) Test Bridge Table – There is a many-to-many relationship between the components and the tests, so I followed the Kimball approach and built a bridge table.
3) Build Information – This hidden table is used to help me get the Power BI Dataset name for the concatenated key when building the denominator. Unfortunately, the Measure, Table, and Calculated Column schemas don’t identify the dataset name. However, the Calculation Dependencies schema does have it, so we can use the SharePoint List ID to fetch that information.
4) Dates – The SharePoint REST API sends dates back in UTC, so the Created Date field in the dataset is in UTC. If you need to adjust for time zones, I suggest modifying that column. The Power User has a good blog article on the topic of time zones.
If you’re not interested in using the template but want to see the Low-Code coverage report in action, I published it to the web at this link. Please let me know what you think on LinkedIn or Twitter.