DataOps Principle #8: Reflect
I’m on a ship with no compass… that’s how I felt about our testing. Our team had done a decent job implementing the testing of our Power BI datasets, but how could our team reflect on its operations without knowing if we are testing at acceptable levels? Or worse, if someone was adjusting the tests and accidentally reduced the amount of testing being applied.
As a project manager I was tasked with building dashboards to facilitate a client’s ability to reflect on their performance and track their progress towards a goal. Was I a hypocrite if I couldn’t do the same with my team’s development of the dashboards? It sure felt like it.
DataOps Principle #8: Analytic teams should fine-tune their operational performance by self-reflecting, at regular intervals, on feedback provided by their customers, themselves, and operational statistics.
The Challenge
In software testing, code coverage and its related metrics allows teams to reflect on the quality of the products being developed. But low-code tools, like Power BI, do not inherently let you evaluate the tests of M code or DAX code as you would expect. For example, take the DAX measure:
IF([Sum of Sales]>64,”Green”,”Red”)
If I could hypothetically convert this DAX measure and the tests we’ve written to JavaScript, I could use tools (like Istanbul) to inspect the tests of the code and get answers to the following questions:
Function Coverage – Did I test that DAX measure?
Statement Coverage – Did I test every line of that DAX measure?
Branch Coverage – Did I test the second argument in that IF statement of that DAX measure?
Best Practices… sort of.
So far this blog article has asked several questions and provided no answers. Well, my answers are a work in progress… and I feel like what I have built is something between MacGyver and Rude Golberg. But I’ll let you decide. This has worked with a few of my Power BI projects, and our team can now reflect on our testing and we can set goals.
Low-Code Coverage Tool
I use the term Low-Code Coverage, because my solution, without true access to the underlying code, cannot fully calculate function, statement, or branch coverage and meet the definition (in my opinion) of code coverage. But I think it can get close.
The tool consists of 5 major components:
1) Tests – Pretty obvious but very important. If you have read Part 5 of this series, you should have the templates and best practices to build tests for tables, rows, and calculated columns for the dataset.
2) Tabular Object Model – The tool needs to be able to update a Power BI dataset and the Tabular Object Model offers the easiest methods to accomplish this in PowerShell. Thanks to Marco Russo's article and Kevin Marquette’s article for their inspiration and guidance on this topic.
3) Dynamic Management Views (DMVs) – Available in premium datasets via XMLA, the tool will use DMVs to get the following metadata information about the dataset:
- Calculation Dependencies ($System.DISCOVER_CALC_DEPENDENCY) -- This table allows us to figure out what measures, tables, and calculated columns are used in the tests created.
- Tables ($System.TMSCHEMA_TABLES) -- This table identifies the tables in the Power BI dataset.
- Measures ($System.TMSCHEMA_MEASURES) -- This table identifies the DAX measures in the Power BI dataset.
- Columns ($System.TMSCHEMA_COLUMNS) -- This table identifies the calculated columns in the Power BI dataset.
DMVs provide us critical information on what measures, tables, and columns are used in our tests and what measures, tables, and columns exist in the dataset. With this information we can calculate Low-Code Coverage metrics.
4) Azure DevOps – I expect the Low-Code Coverage data to be collected for each build of the Power BI dataset, and Azure DevOps will facilitate this need.
5) SharePoint – We need to log Low-Code Coverage data and SharePoint will allow us to track progress with Low-Code Coverage metrics over time. I chose SharePoint because I thought it would be convenient for others to use. If you’re using Power BI and Azure DevOps, there is a good chance you have SharePoint Online available.
Low-Code Coverage Tool in Motion
Alright enough about the components, you probably want to know how it all works in Azure DevOps. Here is the workflow:
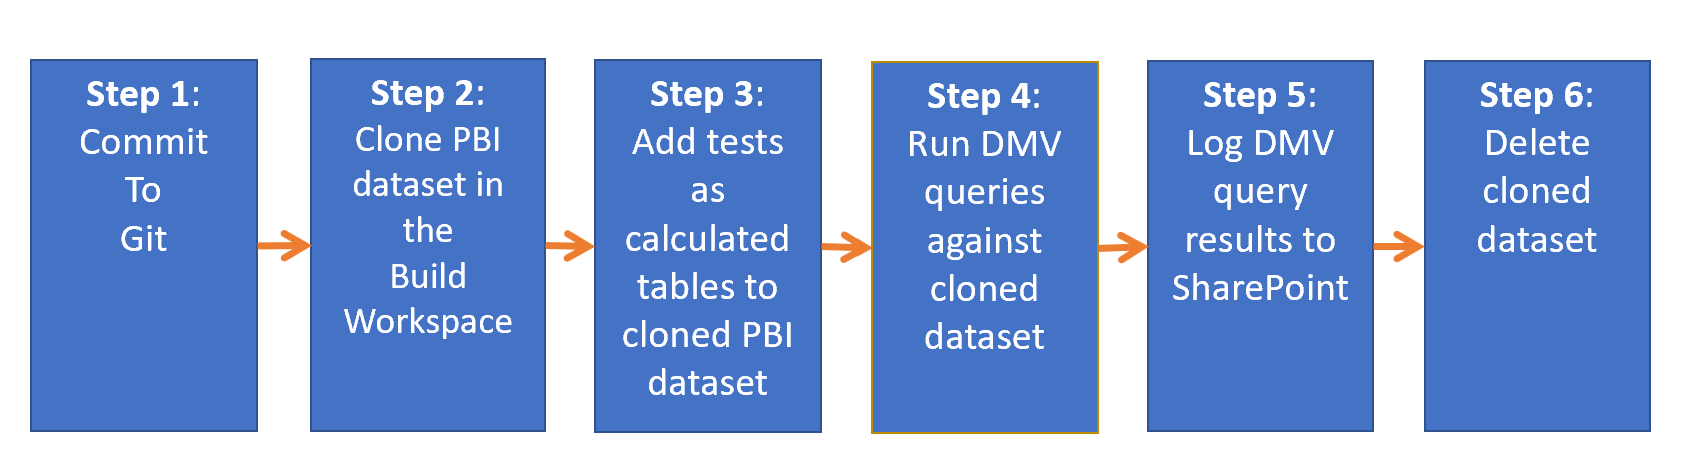 Low-Code Coverage Workflow
Let’s look at each step:
Step 1 – You’ve updated the tests for the Power BI dataset and now pushed the changes to Git on Azure DevOps.
Step 2 – Any .pbix file within the PBI project folder is cloned and published to the Build workspace with a unique name. I wanted to make sure the original Power BI dataset in the build was immutable and would not be impacted by this process.
Step 3 – Any tests sitting in the same folder as each .pbix file are added as a calculated table using the Tabular Object Model. This does require it to be installed when the build agent in Azure DevOps runs, and this will add to the time it takes the pipeline to complete. You can look at custom build agents to save on build times (sounds like a future blog post)
Step 4 – The tests are now in the cloned dataset, so we can query the DMVs to get the information we need for Low-Code Coverage.
Step 5 – With the query results retrieved, we log them to a SharePoint list that can store the query results and build ID.
Step 6 – The cloned dataset has served its purpose and is deleted to clean up the Build workspace.
I feel like that was a lot to unpack in one article, so I have created a proof-of-concept in GitHub that will run Steps 1-6 on an Azure DevOps pipeline. Please let me know what you think on LinkedIn or Twitter.
In my next article, I’ll show how you can take the data logged to SharePoint and build Low-Code Coverage metrics with Power BI.