DataOps Principle #18 – Improve Cycle Times
Late in September 2022, I had the chance to meet with Mathias Thierbach, author of a phenomenal tool called pbi-tools. During that time, we had the chance to talk about a number of DataOps related topics including version control and testing. One area that we had a good time discussing was how we could test the visuals and the look-and-feel of a Power BI report. If we could automate some visual testing, Power BI developers could improve the cycle time to deliver high quality solutions.
DataOps Principle #18: We should strive to minimize the time and effort to turn a customer need into an analytic idea, create it in development, release it as a repeatable production process, and finally refactor and reuse that product.
Since September we’ve been quite busy with our day jobs, but recently I had to improve the consistency in the user experience and accessibility standards for a project with Power BI reports. For the project team, the effort to manually check for consistent branding, user experience, accessibility, etc. was a manual endeavor, it impeded delivery timelines, and led to the deployment of solutions that did not completely meet standards. While Microsoft provides guidance for creating accessible reports, automating checks for this guidance, and thus improving cycle times, posed one big challenge:
1) Access to visual and report settings – Through Dynamic Management Views and XMLA, Microsoft offers ways to interface technically with the data model, but an out-of-the-box way to interface technically with the visual or report settings does not exist.
Thankfully, pbi-tools offered a third-party solution. With its extract command, the tool can pull all the settings (data model and visuals) from a .pbix file into a series of folders and file formats that make the visual and reports settings much more accessible. Furthermore, with its watch command, the tool will automatically run the extract command every time you save the file. With pbi-tools as a solution, now I could focus on the steps towards improving cycle time.
The First Step
While I had become familiar with pbi-tools, the first step was to simplify the watch and extract process for other Power BI analysts. Asking analysts to figure out the network port number that their current Power BI file was using and making sure they extract the contents of the Power BI file to the right folder was prone to error. So, for our project template, I added a simple PowerShell command called Watch-PBI.ps1.
Watch-PBI.ps1
When updating Power BI files within this project, you can track changes by following the steps below.
1) Within Visual Studio Code click the terminal menu option and select “New Terminal”.
2) From the terminal enter .\Watch-PBI.ps1 “{FileName}” where {FileName} is the name of the Power BI file in double quotes (example below).

3) If the Power BI file is not opened already, it will launch Power BI Desktop and initiate the extract and watch. If the Power BI file is already opened it will immediately initiate the extract and watch.
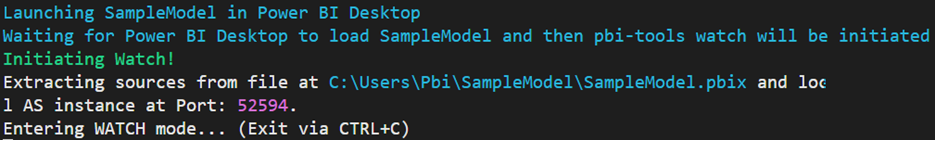
4) Now you can update the Power BI file and when you save the file locally (Ctrl+S), pbi-tools will automatically update the contents within the PbixProj folder identifying the changes.
The Second Step
Next it was important to enable a Power BI analyst to generate the tests from a template. By following a template approach, I could empower the Power BI analyst to adjust any of the tests based on requirements or make exceptions to the rules, also known as fudge-ability (this term I learned from The Inmates Are Running the Asylum, an excellent book on user interface design). By leveraging the Gherkin approach I’ve discussed in Part 23, I built another PowerShell command called Generate-Tests.ps1
Generate-Tests.ps1
Generating tests are based on the Behavior Drive Development (BDD) concept. Pester Version 4’s implementation of the Gherkin language facilitates BDD testing by defining tests through written narratives and acceptance criteria.
Tests are based on two files:
.feature file - The type of tests written in plain language.
.steps.ps1 - The implementation of the tests.
To generate a template, here are the steps:
1) Within Visual Studio Code click the terminal menu option and select “New Terminal”.

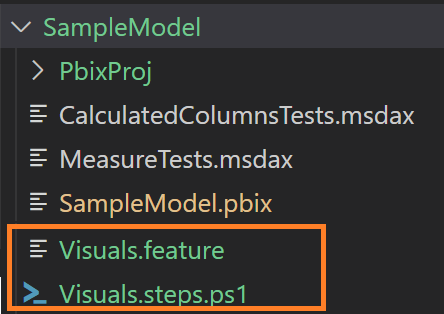
2) Then from the terminal enter the command .\Generate-Tests.ps1 -Filename {PBIX} -Type “Visuals” where {PBIX} is replaced with the name of the Power BI file you wish to generate test cases for visuals.

3) If the command runs successfully, then two files will appear (example outlined in orange below) in the project’s sub-folder.
Visuals Test Contents
Within the Visual.feature file are several tests that are described in the next section; however, there are some important things to point out:
1) You can disable and/or skip a test by putting a hash tag (‘#’) preceding the test.
2) You can disable running a whole scenario or scenario outline by putting a hash tag (‘#’) preceding the appropriate scenario or scenario outline.
The Final Step
With the two prior steps completed, we had a good foundation to leverage pbi-tools and Gherkin in a repeatable manner for testing visuals and report settings. Now I just needed to break out some more PowerShell to (1) extract the contents into a PowerShell object that would represent the visuals and report settings and (2) define tests against that PowerShell object.
I built a PowerShell module in the project template called Get-PBIToolsConfigurations.psm1 to extract the contents and implemented my own unit tests using Pester (testing code that tests other code, I just can’t help myself). Then with a PowerShell object, I built a preliminary set of tests. This next section is quite lengthy, but I go into each of the 22 tests available in the template to better explain the level of automated testing available (or you can skip to the end… I won’t judge).
Visual Tests for Reports
1) Given that we have the report settings
This verifies that a PbixProj folder exists for the report and has extracted data using pbi-tools.
2) Then the default section is the {1st or 2nd or 3rd…} section
This verifies that the nth tab (typically 1st) is the default tab that opens in the Power BI service for the report. Often when working on a report it’s easy to save and publish on a tab that is not considered the default. This helps verify that’s not an issue.
3) Then all report-level measures have a prefix: “{MEASURE_PREFIX}”
For measures created on “thin” reports or reports that are connected to a Power BI dataset, you can implement a prefix naming convention using the parameter {MEASURE_PREFIX}.
4) And the report uses a custom theme named “{THEME_FILE}”
Accepts {THEME_FILE} parameter and will verify the report uses that theme file.
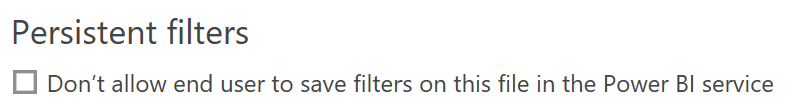
5) And the Persistent Filters setting is {enabled or disabled}
Accepts “enabled” or “disabled” parameter. Under the Options->Current File->Report Settings file in Power BI Desktop, this verifies the setting’s status in the image below.
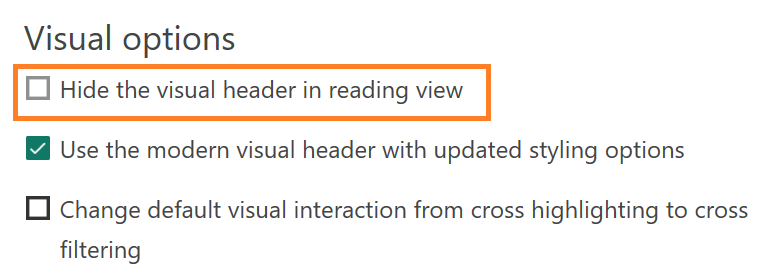
6) And the Visual Option “Hide the visual header in reading view” is {enabled or disabled}
Accepts “enabled” or “disabled” parameter. Under the Options->Current File->Report Settings file in Power BI Desktop, this verifies the setting’s status in the image below (outlined in orange).
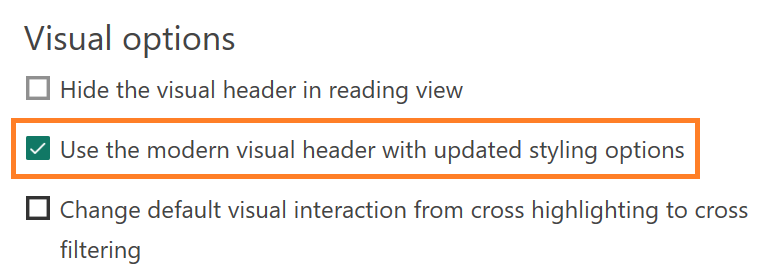
7) And the Visual Option “Use the modern visual header with updated styling options” is {enabled or disabled}
Accepts “enabled” or “disabled” parameter. Under the Options->Current File->Report Settings file in Power BI Desktop, this verifies the setting’s status in the image below (outlined in orange).
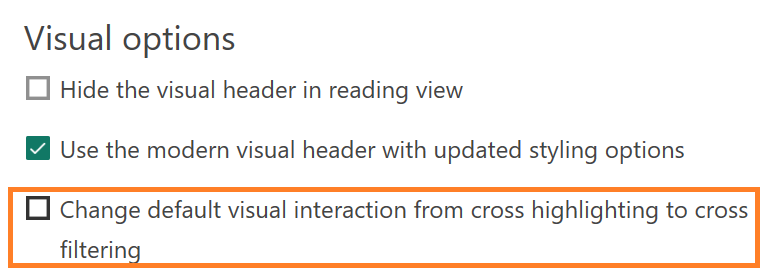
8) And the Visual Option “Change default visual interaction from cross highlighting to cross filtering” is {enabled or disabled}
Accepts “enabled” or “disabled” parameter. Under the Options->Current File->Report Settings file in Power BI Desktop, this verifies the setting’s status in the image below (outlined in orange).
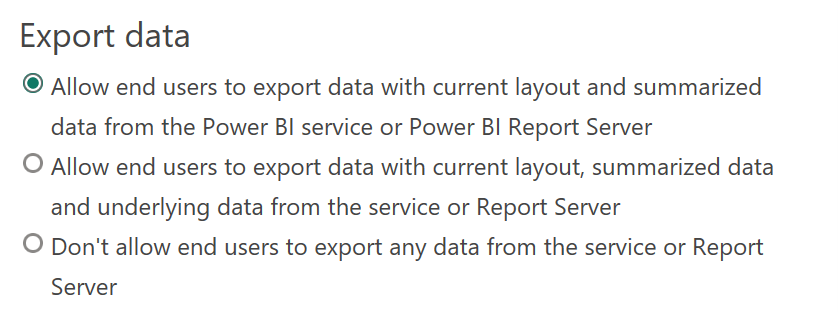
9) And the Export data setting is {export summarized data only, export summarized and underlying data or no export allowed}
Under the Options->Current File->Report Settings file in Power BI Desktop, this verifies the setting’s status in the image below.
Accepts:
“export summarized data only” - option 1 in image below.
“export summarized and underlying data” - option 2 in image below.
“no export allowed” - option 3 in image below.
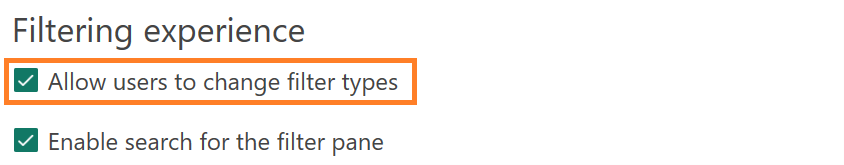
10) And the Filtering experience “Allow users to change filter types” is {enabled or disabled}
Accepts “enabled” or “disabled” parameter. Under the Options->Current File->Report Settings file in Power BI Desktop, this verifies the setting’s status in the image below (outlined in orange).
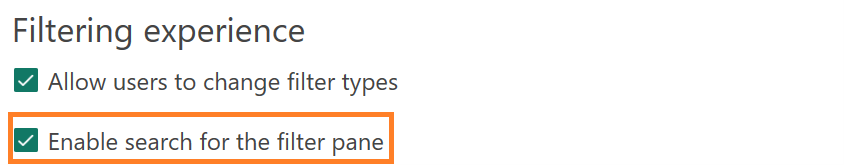
11) And the Filtering experience “Enable search for the filter pane” is {enabled or disabled}
Accepts “enabled” or “disabled” parameter. Under the Options->Current File->Report Settings file in Power BI Desktop, this verifies the setting’s status in the image below (outlined in orange).
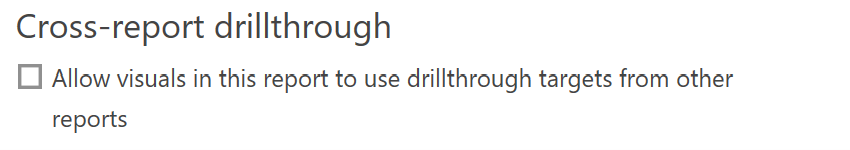
12) And the Cross-report drillthrough setting “Allow visuals in this report to use drillthrough targets from other reports” is {enabled or disabled}
Accepts “enabled” or “disabled” parameter. Under the Options->Current File->Report Settings file in Power BI Desktop, this verifies the setting’s status in the image below.
13) And the Personalize visuals setting “Allow report readers to personalize visuals to suit their needs” is {enabled or disabled}
Accepts “enabled” or “disabled” parameter. Under the Options->Current File->Report Settings file in Power BI Desktop, this verifies the setting’s status in the image below.

14) And the Developer Mode setting “Turn on developer mode for custom visuals for this session” is {enabled or disabled}
Accepts “enabled” or “disabled” parameter. Under the Options->Current File->Report Settings file in Power BI Desktop, this verifies the setting’s status in the image below.

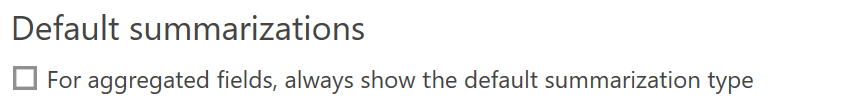
15) And the Default summarizations setting “For aggregated fields, always show the default summarization type” is {enabled or disabled}
Accepts “enabled” or “disabled” parameter. Under the Options->Current File->Report Settings file in Power BI Desktop, this verifies the setting’s status in the image below.
Visual Tests for Sections
These tests rely on a scenario outline so it can run tests for each section (example below). Sections are considered tabs in the Power BI report.
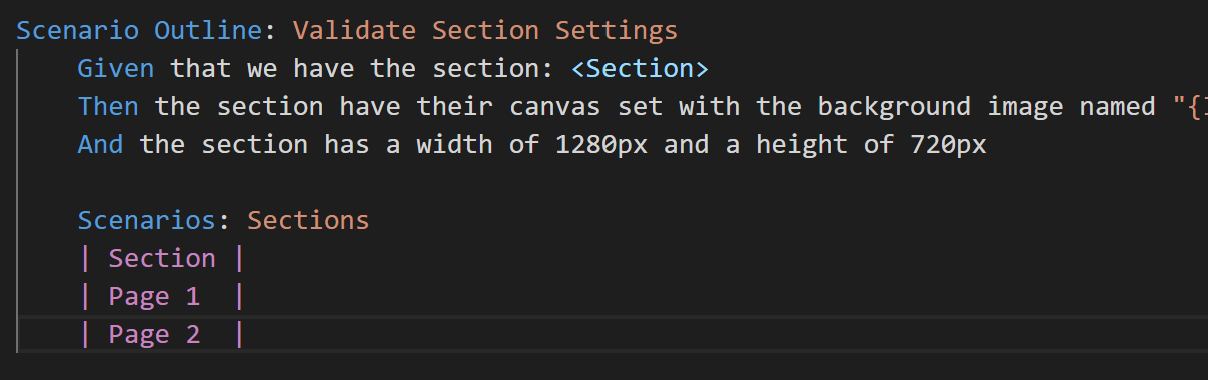
1) Given that we have the section: <Section>
This verifies the section exists in the report configuration files.
2) Then the section has their {canvas or wallpaper} set with the background image named “{IMAGE_FILE}”
This accepts the canvas or wallpaper parameter; the settings are found in the visualizations pane for a specific section (outlined in orange in the image below)
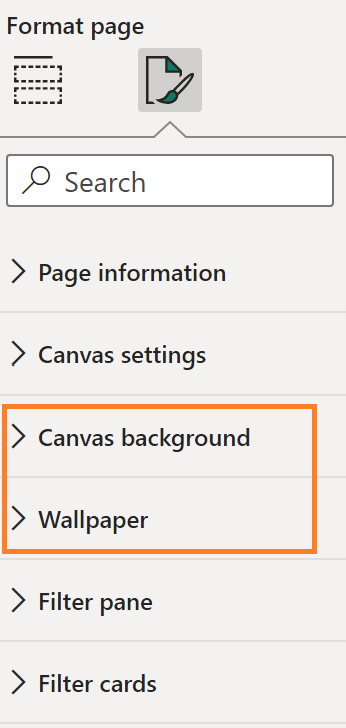
This also accepts the {IMAGE_FILE} parameter which should be the name of the image used in with the wallpaper or canvas.
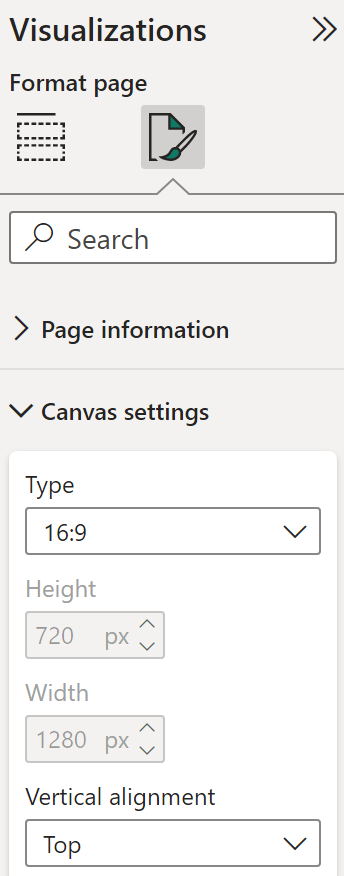
3) And the section has a width of {WIDTH}px and a height of {HEIGHT}px
This accepts the {WIDTH} and {HEIGHT} parameters in pixels and verifies the Canvas Settings height and width (image below).
Visual Tests for Visuals
These tests rely on a scenario outline so it can run tests on each visual (example below). VisualID is the unique identifier in Power BI for that visual within the report and the ConfigPath is the relative path to the config.json file for the visual. The ConfigPath is key to understanding which visual in your Power BI report may have an error. I wish I had a more elegant solution, so I’m open to other ideas.
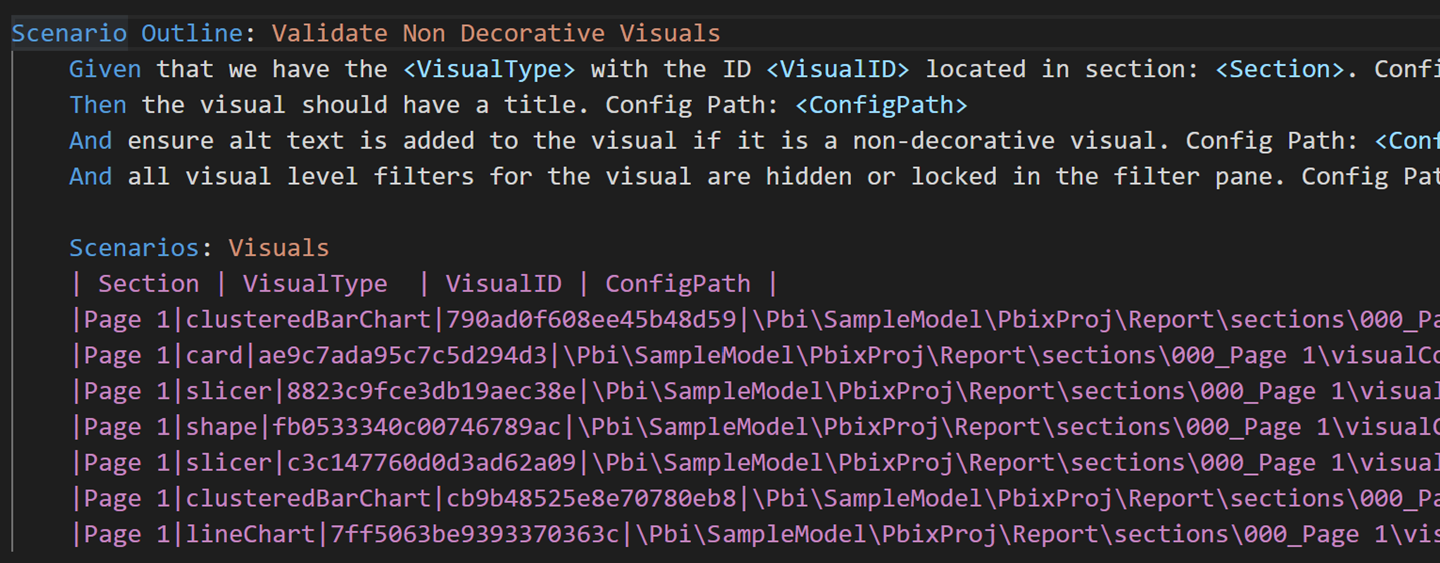
1) Given that we have the with the ID located in section: <Section>. Config Path:
This verifies the visual exists in the section.
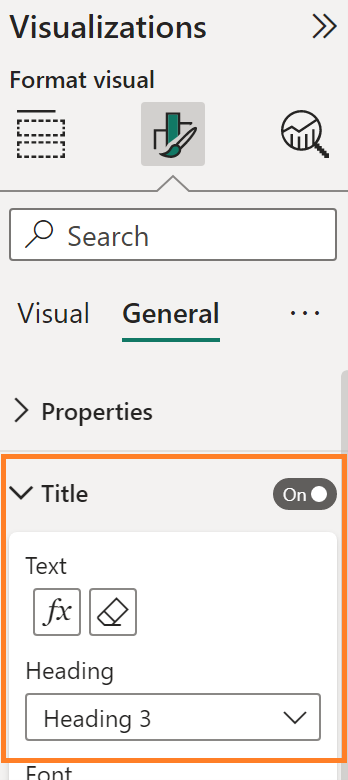
2) Then the visual should have a title. Config Path:
This verifies the visual has a title as recommended for accessibility. The title does not need to be toggled on in order for this test to pass; it just needs either a literal value or conditional formatting set.
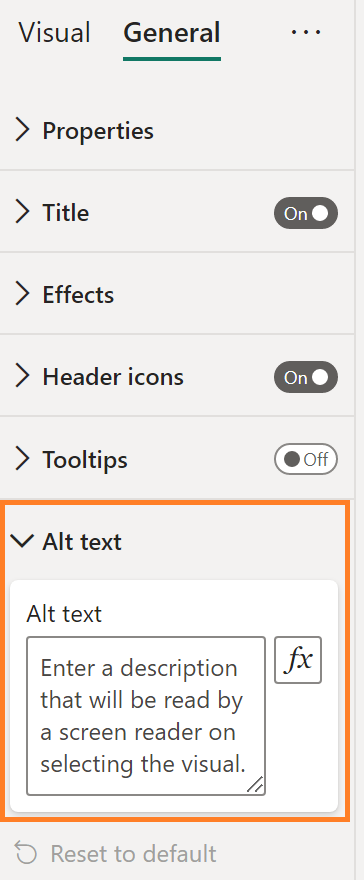
3) And ensure alt text is added to the visual if it is a non-decorative visual. Config Path:
This verifies the visual has an alt text as recommended for accessibility. If the visual is hidden on the tab order (when hidden, it’s considered decorative), this test passes by default.
4) And all visual level filters for the visual are hidden or locked in the filter pane. Config Path:
If you’d like to make sure a visual hides or locks its filters, this test will enforce that. Often, design policies will want report-level or page-level filters only. By locking or hiding visual level filters, you can improve the user experience with the filter pane. If the filter pane is hidden, this test passes by default.
Feedback
If you’ve made it this far into the article, thanks! I’ve updated the template with instructions on GitHub. If you use the SampleModel to try out the visual tests, I’ve intentionally left some visuals with blank titles and blank alt text settings, so you could see the failed tests both locally and when it runs in the pipeline.
There are other tests I’d like to build, so if you’re interested in testing tab order or color contrast ratios using this technique, please contact me.
I’d love to hear your thoughts on this subject, so let me know on LinkedIn, Twitter, or Mastodon.
Last but certainly not least, thank you Mathias for creating pbi-tools and making these type of tests possible.