DataOps Principle #9: Analytics is code (cont.)
And now we address Challenge #2… In Part 14 I identified the challenge of setting expectations on a refreshed dataset in Power BI. More specifically how do we look for the issues of data drift, the unexpected and undocumented changes to data structure and semantics, in our production datasets?
Testing, Testing, Testing…
If you have read through the series, you may have noticed I am a big proponent of testing. If my co-workers were quizzed on what topics I like to talk about the most, there is a high probability that one of the topics will be “testing” (the second would probably be DataOps). So my proposed solution includes (drum roll)… Testing! (to the surprise of no one). Let me elaborate on how we should test though.
Using the scaffolding from Part 5 we can update the folder structure so that we can distinguish the tests we have built during development (CI) from the tests to identify cases of data drift (CD).
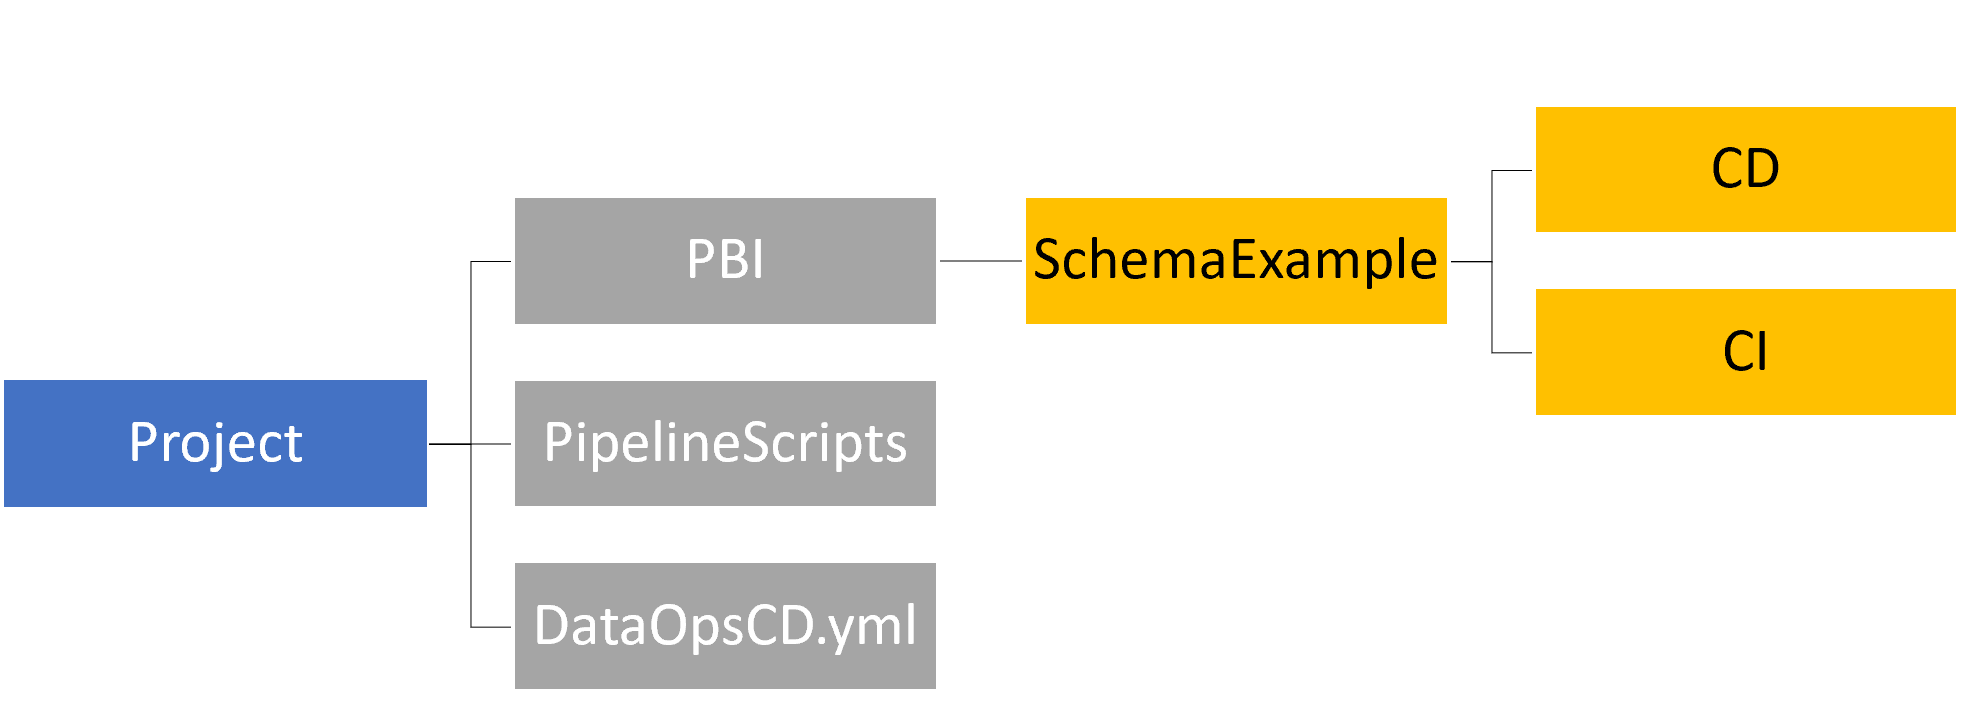 Figure 1 – An updated folder structure to support Continuous Integration and Continuous Deployment testing Let’s look at the folders and files more closely:
- PBI – This is where you would store a folder named after each Power BI dataset and each dataset has the following subfolders:
- CI – This is where you store .msdax or .dax files as described in Part 4 to test for issues/regression errors in your model using a static dataset.
- CD – This is where you store .msdax or .dax files that will test a dataset in a staging workspace looking for potential issues before that dataset is moved to production. More on what type of tests you should create below.
- PipelineScripts – The files in this folder inform Azure DevOps how to orchestrate the testing.
- DataOpsCD.yml – The YAML file that guides the orchestration of the pipeline. Figure 2 extends the pipeline in Part 14 to now include testing for data drift.
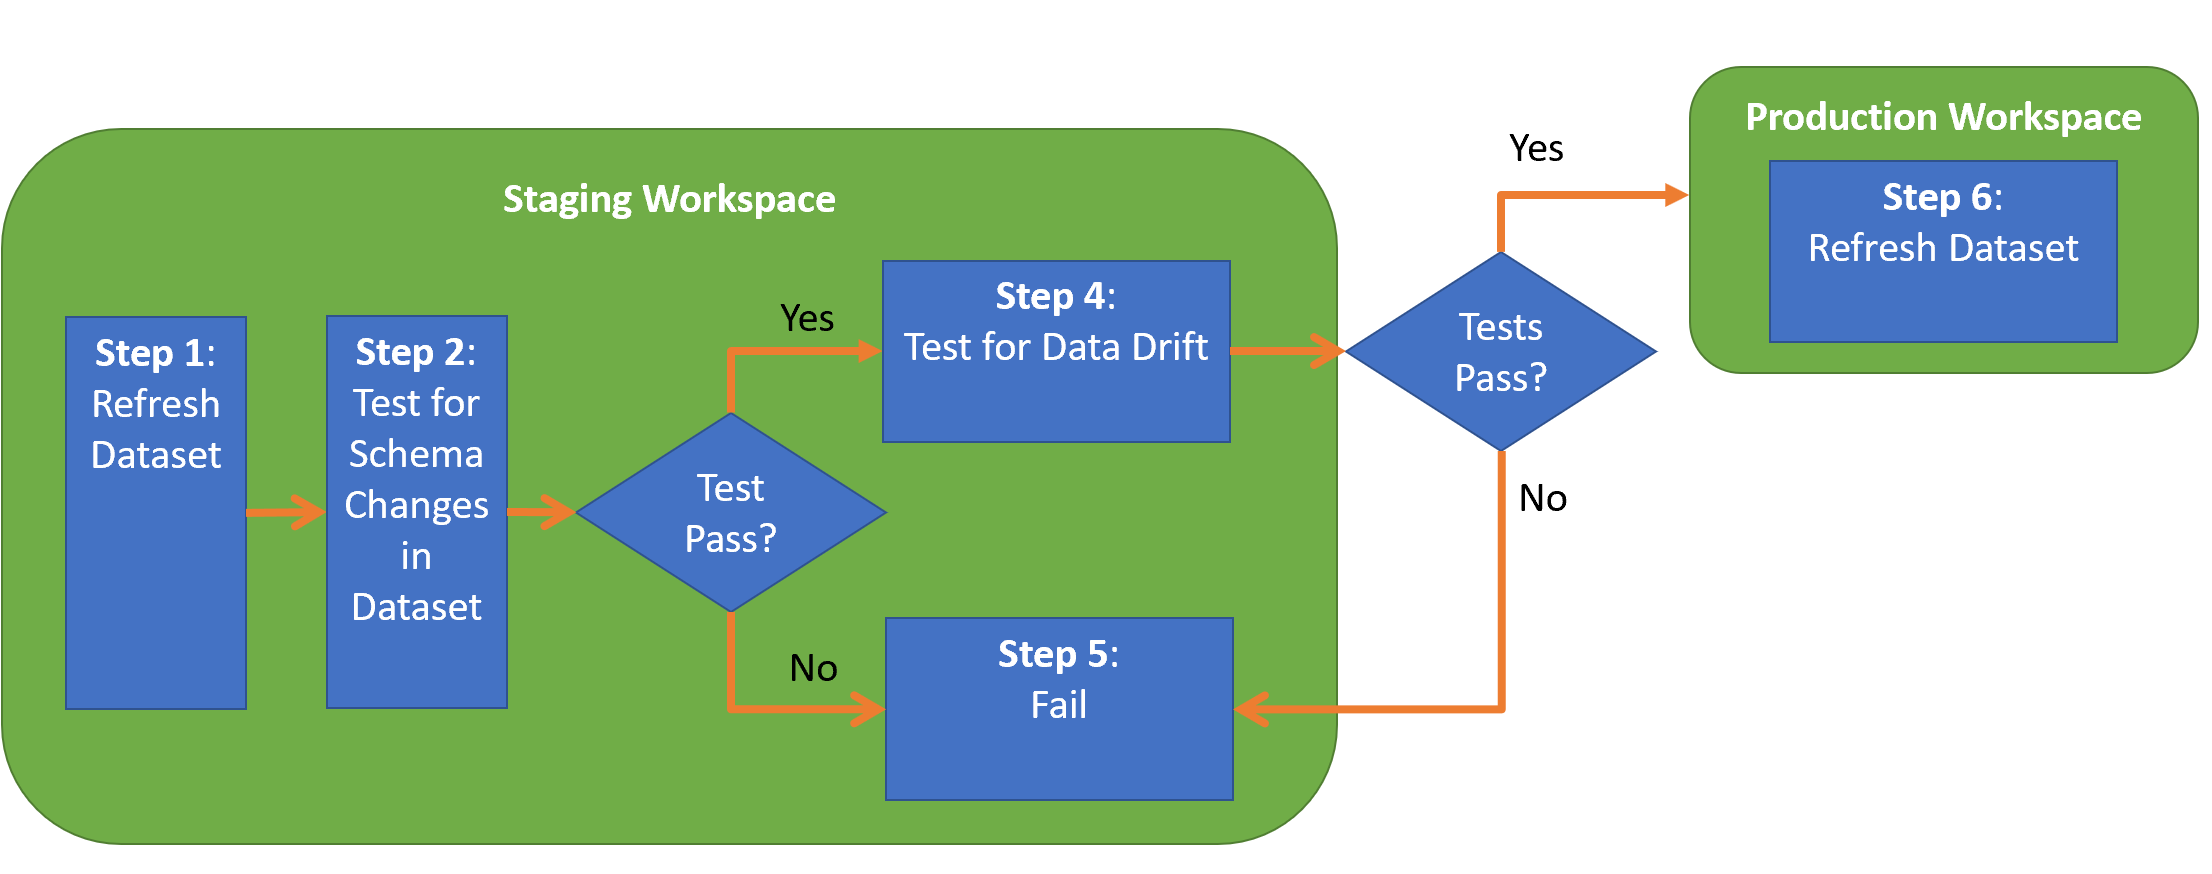
Figure 2 – The updated Continuous Deployment Pipeline
What to test
With the folder structure and pipeline in place, how do we test for data drift using DAX? First, I recommend using a schema like I described for automated tests in Part 4. Second, I focus on testing columns within each table in a dataset using the following categories of tests:
- Primary Keys/Distinct Values – Nothing can throw off a model's behavior more than when a column value you expected to be unique, isn't unique. In order to test for that I've found the two DAX functions, COUNTROWS and DISTINCTCOUNT, to be helpful. Using these two functions we can calculate how many rows exist for table that has that column and then calculate the distinct values for that column. Here is an example:
Then it's a matter of testing if the values are equal. If not, we have a problem.// Row Count VAR _Row_Count = COUNTROWS ( 'Test Table') + 0 // Id has distinct values VAR _Id_Distinct_Count = DISTINCTCOUNT ( 'Test Table'[Id] ) + 0 - Data Has Acceptable Values – This can take a couple of forms: 1) *Verifying a column has no null columns* – The example below calculates the number of null values in the Title column. A test case would fail if this variable is greater than 0.
2) *Verifying a column has acceptable values* – If you have a known list of values, you can calculate how many rows have this acceptable set of values. The example below checks for acceptable values using the IN command and also includes allowing blank values to occur (which can be included or excluded depending on the need). If the Row Count for the table does not match the result of this DAX expression, then the test case would fail.// Calculate if blank values exist in the title column VAR _Title_Is_Not_Blank = CALCULATE ( COUNTROWS ( VALUES ( 'Test Table'[Title] ) ) + 0, ISBLANK ( TRIM ( 'Test Table'[Title] ) ) )
Wondering about using a Regular Expression to test the contents of columns? Well, as of February 2022, that is not built into DAX and should be discussed at a later time (I smell a future blog article!) 3) *Verifying a column is in an acceptable range* – This form is helpful for a numeric or date column. For example, if you expect dates to not be in the future, then you can build a test to make sure the source systems don't supply future dates without a test highlighting the problem.// Test for acceptable values VAR _Acceptable_Values_Example = CALCULATE ( COUNTROWS ( 'Test Table' ) + 0, FILTER ( VALUES ( 'Test Table'[New Column] ), 'Test Table'[New Column] IN { "A", "B" } || LEN ( TRIM ( 'Test Table'[New Column] ) ) = 0 || ISBLANK ( 'Test Table'[New Column] ) ) )// Dates are less than today VAR _Dates_In_Acceptable_Range = CALCULATE ( COUNTROWS ( 'Test Table' ) + 0, FILTER ( VALUES ( 'Test Table' ), 'Test Table'[Date Received] < TODAY () ) ) - Acceptable Null Percentage – Sometimes a column may contain null values, but you may need to monitor if the percentage of null values increases to an unacceptable threshold. You don't want a critical column in a dimension to increasingly contain null values without your knowledge! In the example below, the DAX formula counts the number of blanks and divides by the row count using the DIVIDE function (better than using the '/' operator because row count could be 0 and lead to a divide by zero issue).
    // Null Percentage
    VAR _Null_Per_Example =
        DIVIDE ( COUNTBLANK ( 'Test Table'[Null Example] ) + 0, _Row_Count, 0 )
You don’t have to start from scratch because I’ve built examples of each aforementioned category of tests for a simple Power BI dataset along with an updated pipeline that mimics the flow in Figure 2. Instructions for downloading and installing this sample is available on GitHub.
What are your thoughts on this approach? Could my DAX test cases be improved? Please let me know what you think on LinkedIn or Twitter.