DataOps Principle #14: Analytics is Manufacturing (cont.)
“Time is money”… Continuing our work from Part 10 we have the data to help us understand (1) if self-hosted agents run faster than the Microsoft-hosted agent and (2) if we get a return on investment using a self-hosted agent by not paying staff to wait for a pipeline to run.
DataOps Principle #14: Analytic pipelines are analogous to lean manufacturing lines. We believe a fundamental concept of DataOps is a focus on process-thinking aimed at achieving continuous efficiencies in the manufacture of analytic insight.
To do this in Power BI involved a little bit of research. First, I wanted to avoid inputting any data manually, so that it could be templated for other projects. That meant I had to figure out how to work with the Azure DevOps and Azure Pricing APIs.
Azure DevOps API
First, either the documentation had some issues or my reading comprehension was failing me (a possibility). Regardless, I had three issues:
In order to pull data into Power BI I used the Personal Access Token (PAT) to access the API. The PAT had to be Base64 encoded, but I was completely unaware you had to prefix the PAT with a semicolon before Base64 encoding. Thank goodness Stack Overflow had the answer (what would I do without it?) because the Microsoft documentation sure didn’t help me.
I had no clue how to Base64 encode in Power Query. Thanks to Dale on the Power BI Community support page, I found the right incantation. So, as a result, this was the Power Query statement created:
Binary.ToText(Text.ToBinary(":" & #"Personal Access Token"), 0)
- As of October 2021, there is no way in the Azure DevOps API to discover what Azure region your Azure DevOps instance is running on. I wanted to be slick and automatically pull the region information so it could be used to filter the Azure Pricing API by region. That was a big NO… ugh.
After that, I used Web.Contents to query the Pipeline and Builds API endpoints and that was straightforward. If you’re not familiar with Web.Contents, I suggest reading Chris Webb’s article as it is the best documentation out there.
Azure Pricing API
Have you’ve ever tried to figure out cloud pricing and felt confused? Do you like pain? If so, then try to interpret the Azure Pricing API and the JSON that is returned. Trying to figure out the right combination of “serviceFamily” and “serviceName” for Container Registry and Container Instance pricing took countless rounds of attempts in Postman. On top of that, I wanted to get all the Azure regions from the Azure Pricing API since issue #3 with the Azure DevOps API existed. I couldn’t find that endpoint either (double facepalm). I settled with just getting a distinct list of regions from the Container Registry pricing call. Not perfect, but it works.
Whew… that was probably a lot of complaining but for me that was truly cathartic. Plus, I offer you this template on GitHub so you don’t have to be bitter like me.
Putting it together
With the dataset in place, it was time to get the answers into some visuals. From experience, I found an executive summary highlighting the return of investment (ROI) resonated far more with a boss than a chart. That’s why the template Power BI report looks like this:
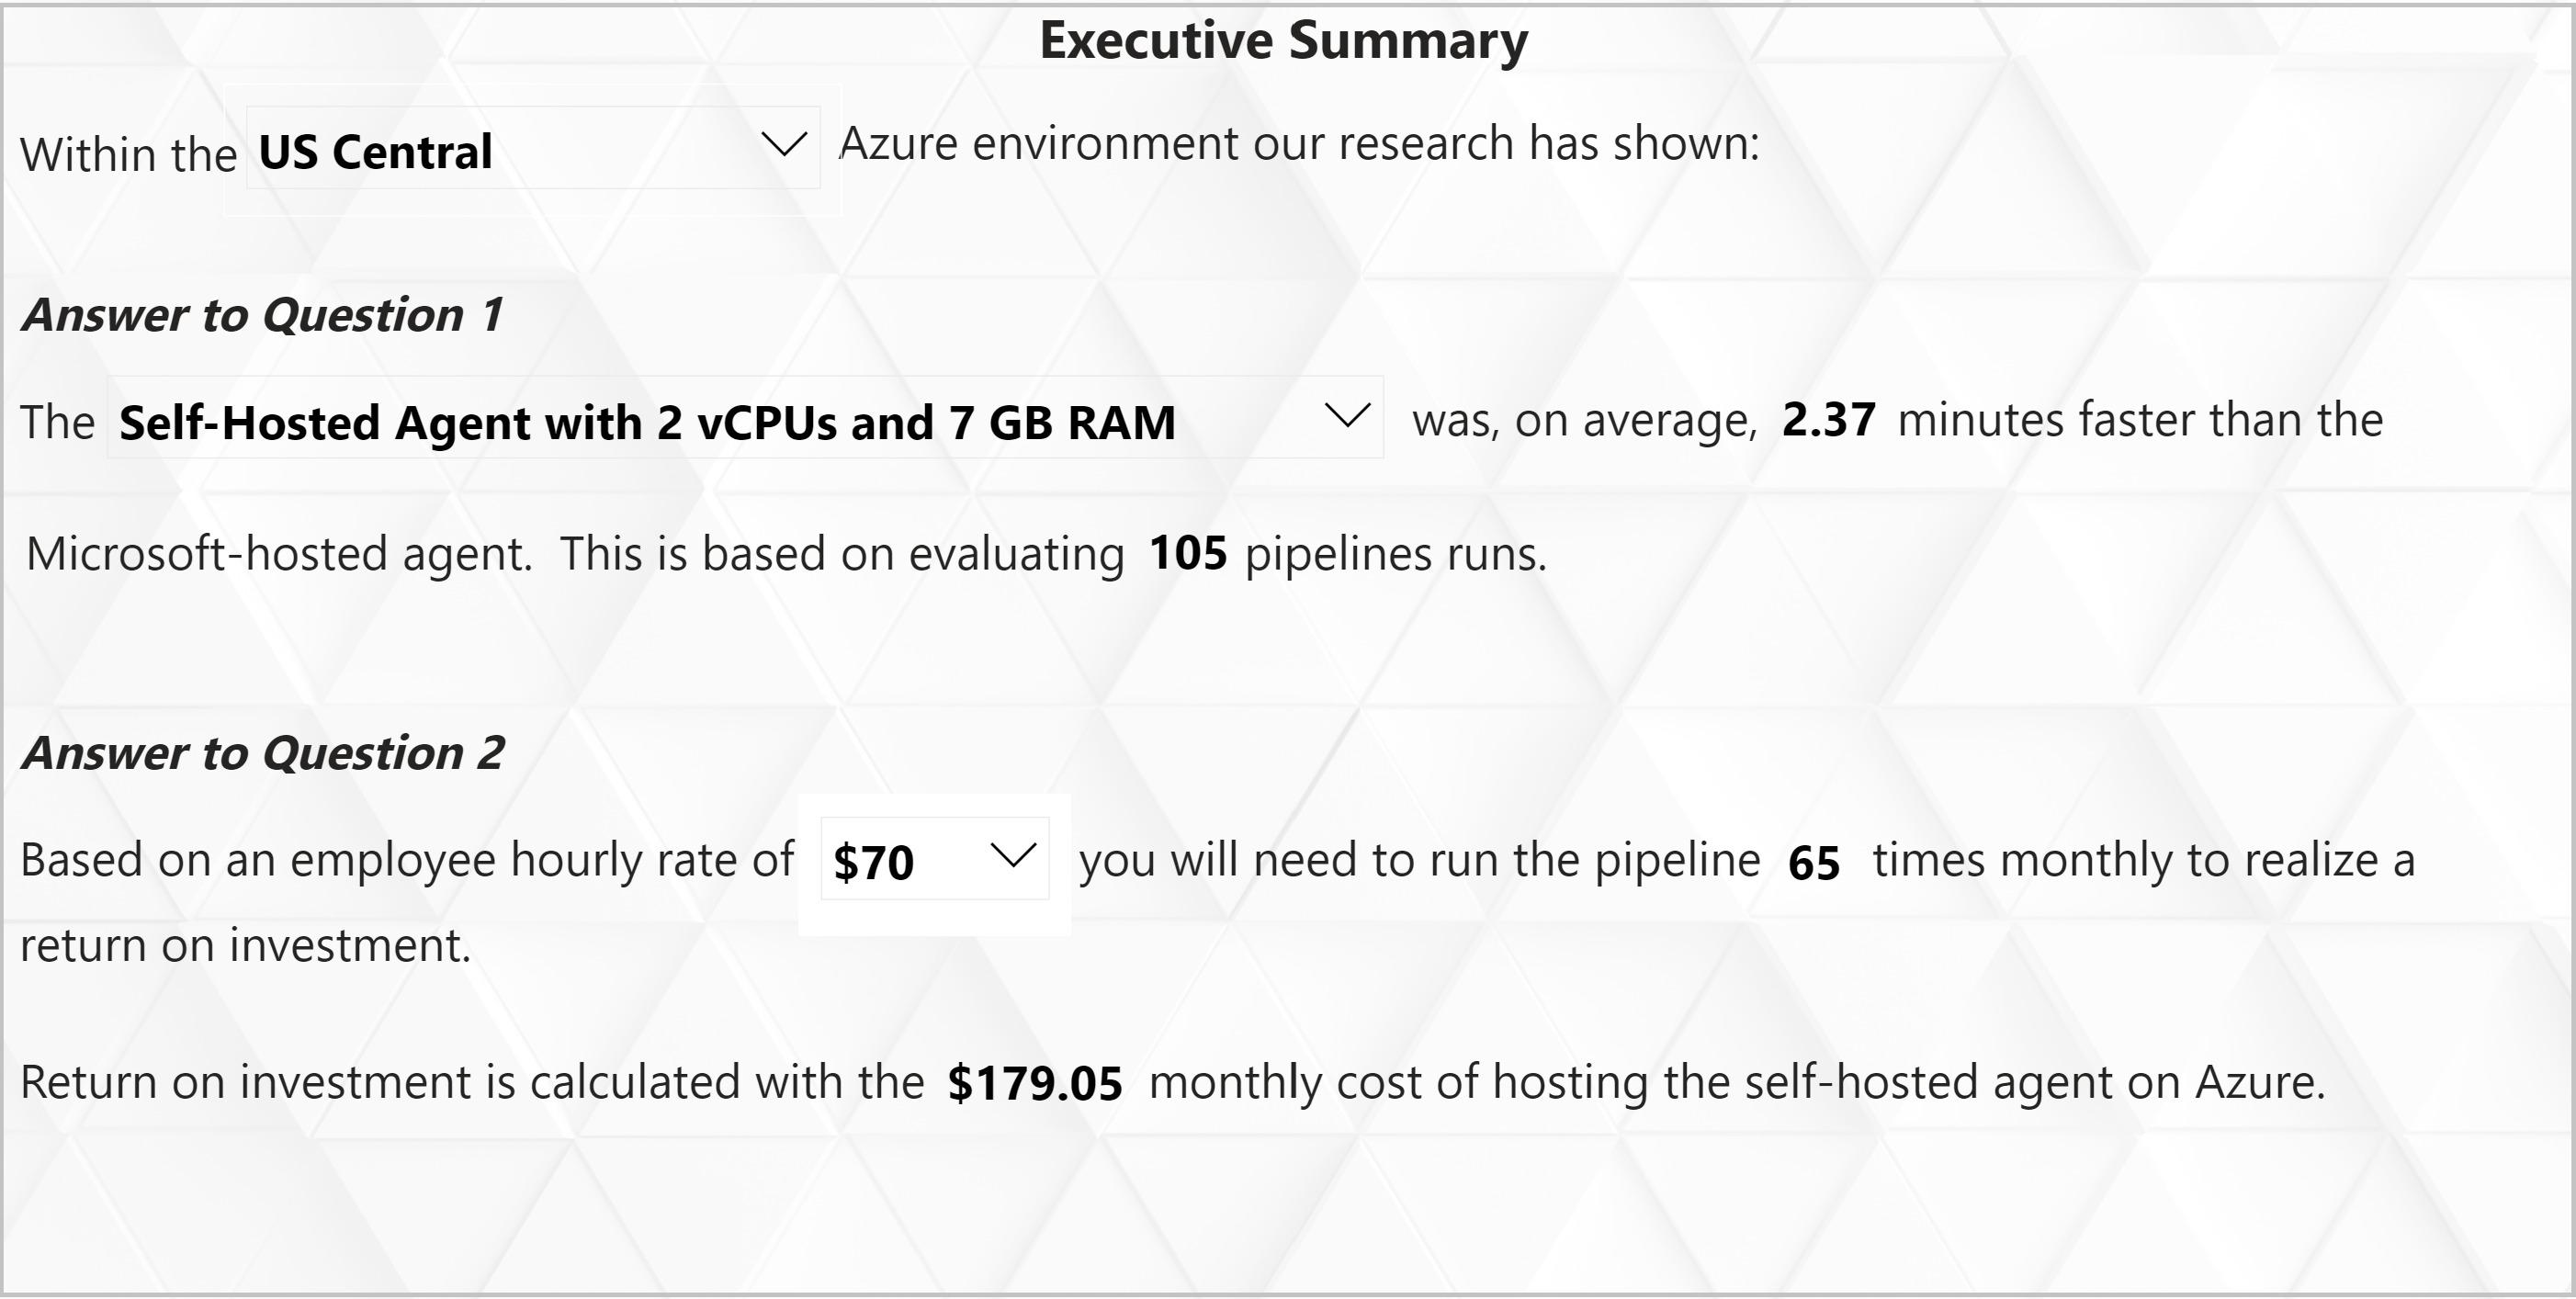
The Executive Summary tab has three drop-downs:
Azure Region - Select the Azure region where your Azure DevOps instance is located.
Build Agent - Select between the two versions of the container instances created from Part 10.
Hourly Rate - For this template you have the choice of selecting between $0 and $200 an hour which will determine the minimum number of runs before you realize a return investment with running a self-hosted agent.
By selecting those three drop-downs, Power BI measures located in the Measures Table will take:
The “Average Time Saved Each Run For Build Agent in Minutes” and multiply it by the “Minute Wage for Staff” to get the “Potential Average Cost Savings Per Run”.
Takes the “Potential Average Cost Savings Per Run”, runs through the hypothetical scenarios of 0 and 200 runs, and identifies the lowest amount of runs required to be greater than the monthly cost to run the self-hosted agent. This was accomplished using the RANKX function in “Rank Cost Avoidance By Number of Runs”.
The Results Are In…
As for my recent project, the executive summary answered the questions from Part 10 as follows:
Question 1A: How much faster can a self-hosted agent run versus a Microsoft-hosted agent? If we can create a self-hosted agent with 7GB of RAM and 2 virtual CPUs (the standard for a Windows image on a Microsoft Hosted Agent) how much faster does it run?
Answer 1A: On average, we saved 2.37 minutes per run.
Question 1B: How much faster can a self-hosted agent run versus a Microsoft-hosted agent? If I increase RAM or virtual CPUs by 50% is there a gain in performance?
Answer 1B: On average, we saved 2.45 minutes per run.
Question 2: Is the cost for running a self-hosted agent cheaper than having staff not wait for pipelines to run? If so, how often must the pipeline run to realize savings?
Answer 2: For confidentiality purposes, I won’t divulge the hourly rate I used, but the answer was yes and the number of monthly runs required to achieve ROI was realistic.
Conclusion
For those that went through Step 10, the Power BI template and the setup instructions for Part 11 have been posted on GitHub. And if you want to try out the Power BI report using data I generated, try it out at this link.
Despite the trials and tribulations of working with the APIs, in the end we were able to empirically show whether or not a self-hosted agent would improve efficiency, saving time and money! As always, if you have any thoughts on this article or corrections/solutions to the issues I had with the APIs, please me know what you think on LinkedIn or Twitter.