DataOps Principle #1: Continually satisfy your customer
It’s complicated… that’s how I would sum up my relationship with SharePoint. On the one hand, SharePoint has helped me deliver modern solutions to clients and helped me advance my career. On the other hand, SharePoint has led me to numerous late nights and elevated blood pressure levels due to features like the list view threshold, lookup threshold, and CAML. Honestly, if it were not for folks like Marc Anderson, Julie Turner, Andrew Connell, Laura Rogers, and Steve Sanderson and their content on how to make the most out of SharePoint, I would have broken up with SharePoint a long time ago.
I have had to learn to work with SharePoint, so when I was monitoring a Power BI model that heavily relied on SharePoint list data and saw it was taking a dramatically longer time to refresh, I took a deep breath, and took the time to understand how to work with SharePoint to improve the refresh time and keep the customer satisfied.
DataOps Principle #1: Our highest priority is to satisfy the customer through the early and continuous delivery of valuable analytic insights from a couple of minutes to weeks.
With this principle in mind, I needed a way to make sure the client could get the data from SharePoint into Power BI as quickly as possible. I did not want automated refresh jobs to take 30 minutes (which is what was happening!). My initial theory was the connector and/or the way the data was being pulled from SharePoint Online was inefficient. While working with the SharePoint Online List Connector it was apparent that all the columns, even the ones not needed, were being pulled into the model. Working on the theory, I needed to look at the options to query the SharePoint data with two main objectives:
1) Only query the data you need. Superfluous columns from SharePoint increase the size of the response over the network. The more data, the more time needed to retrieve that data.
2) Reduce the calls to SharePoint. The less calls to SharePoint to get the data, the less time to refresh Power BI.
With those objectives in mind, I looked at the options:
Option #1 – SharePoint Online List Connector 2.0 (Beta)
Released in October 2020 as beta (non-production) and over a year later it is still in beta (as of April 2022), this connector provides you an option to pull all the column values or the columns in the default view of SharePoint.
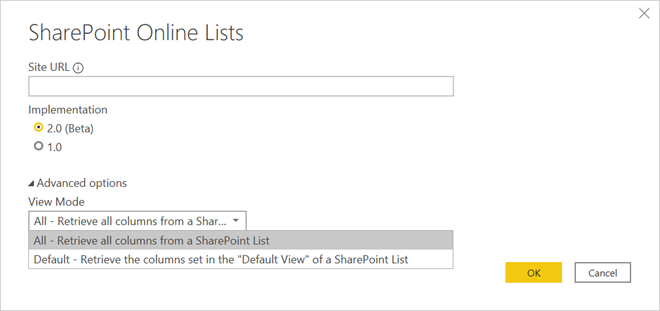
Figure 1 – Option 1, the Beta option
This connector has two issues: 1) It is in beta and not production ready according to Microsoft and 2) if you use the default view option, what happens if that default view changes? I did not manage the SharePoint sites that provided the data and could not guarantee the owner of a SharePoint list would not change the default view. Despite that, this option would let me isolate the columns needed for the Power BI model.
Option #2 – OData Feed
The SharePoint REST API is based on the OData protocol and Power BI offers an OData Connector. With this option I could write a custom set of query string parameters to get the specific columns using the $select and $expand query string parameters (objective #1, check). If I used the “$top=5000” in an OData query, I could retrieve the maximum number of items per call allowed by SharePoint (list view threshold) and minimize the number of calls to SharePoint (objective #2, check). The only problem is the OData feed did not support relative URLs. Not a massive inconvenience, but I like parameterizing connection information because it tends to make the promotion of models between development, test, and production simpler.
Option #3 – Bespoke
This option is using the SharePoint REST API, but instead of using the OData Connector, I could simply use the Web.Contents function in Power Query to issue the queries. It is custom, but I found Web.Contents to be an extremely useful function in Power Query and it offered relative URLs. Thus, it was worth a try.
The Test
To see if these any of these options reduced the time to refresh Power BI, I created two SharePoint lists, one with 8 columns and one with 16 columns with a mixture of single-text, numeric, and choice columns. I then loaded each list with 19,999 items (limit for upload with the Excel feature in SharePoint). This closely represented the SharePoint lists I work with, so it was sufficient for testing.
With the list data in place, I began to build the Power BI Reports for the original SharePoint Online Data Connector, Option #1, Option #2, and Option #3. Each version of the report would only retrieve data and not perform any other actions. This way I was hopefully isolating any refresh time to just the time it takes for Power Query to get the SharePoint data. I ended up with 12 permutations of reports. One set of 4 queried the 8-column list, one set of 4 queried the 16-column list, and one set of 4 that queried both the 8-column list and 16-column list.
With the 12 reports complete, I published the reports, verified the credentials in the data settings, and then had to decide how to run the tests. I had some concern that if I ran the refreshes in parallel, I may encounter throttling by the Power BI service or API throttling by SharePoint. Consequently, I chose to run the Power BI Refreshes serially, at least 8 times (rounds), and randomly selected the order in which the reports refreshed each round. I also chose to run 8 rounds of testing under the license mode for Power BI Pro and Premium Per User to see if refresh times would be different. With the help of PowerShell, I was able to automate these tests.
Finally, I updated the local Power BI monitoring report I shared in Part 2 to track the refresh times for all these reports.
The Results
After over 216 refreshes, the results were in:
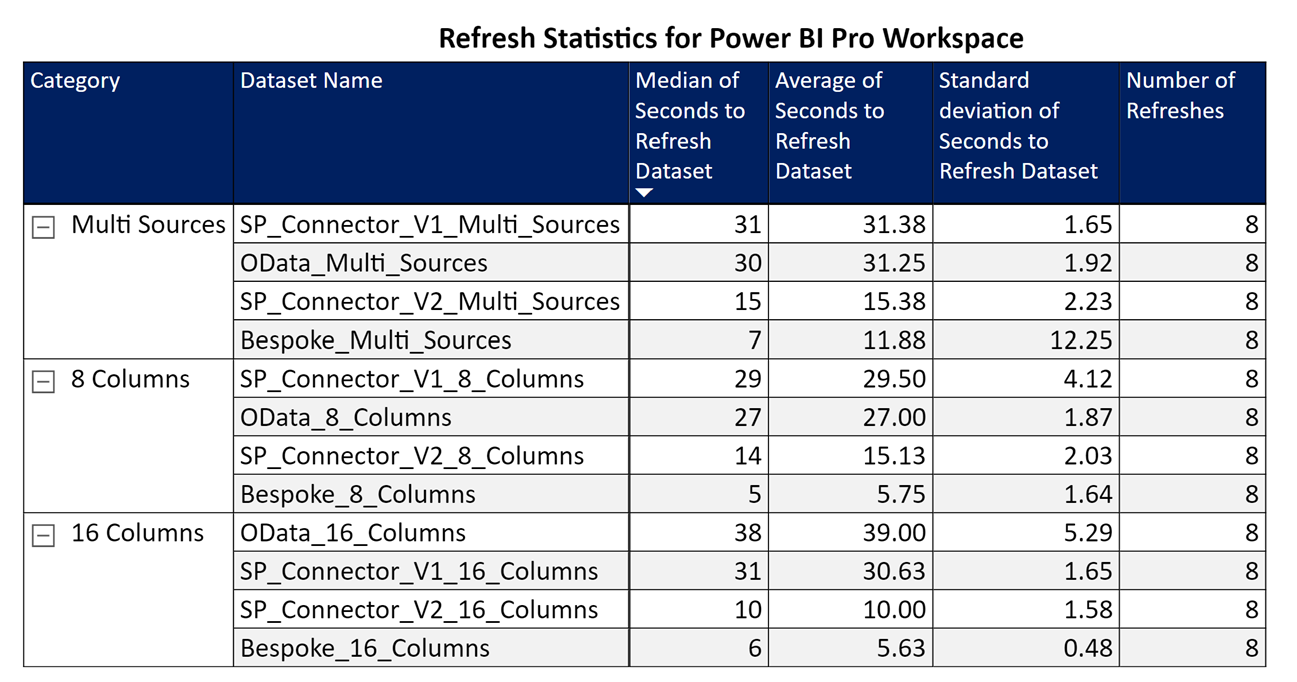
Figure 2 – Pro Workspace Results
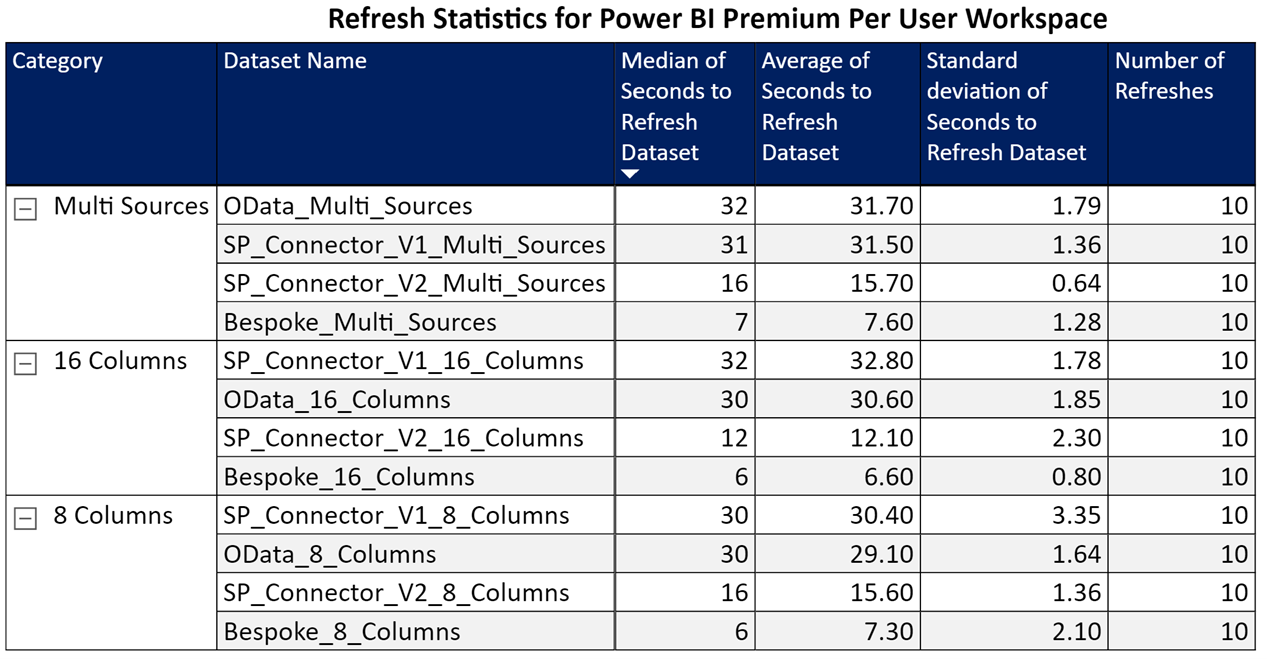
Figure 3 – Premium Per User Workspace Results
I was able to draw two conclusions:
1) For out-of-the-box connectors, Option #1 – SharePoint Online List Connector 2.0 (Beta) was far faster than the default SharePoint Online List Connector (1.0) and OData Connector.
2) The Bespoke implementation (Option #3) was astonishingly quick.
The function in-depth
I was little surprised that the Bespoke function was the fastest, so lets take a closer look at what it does.
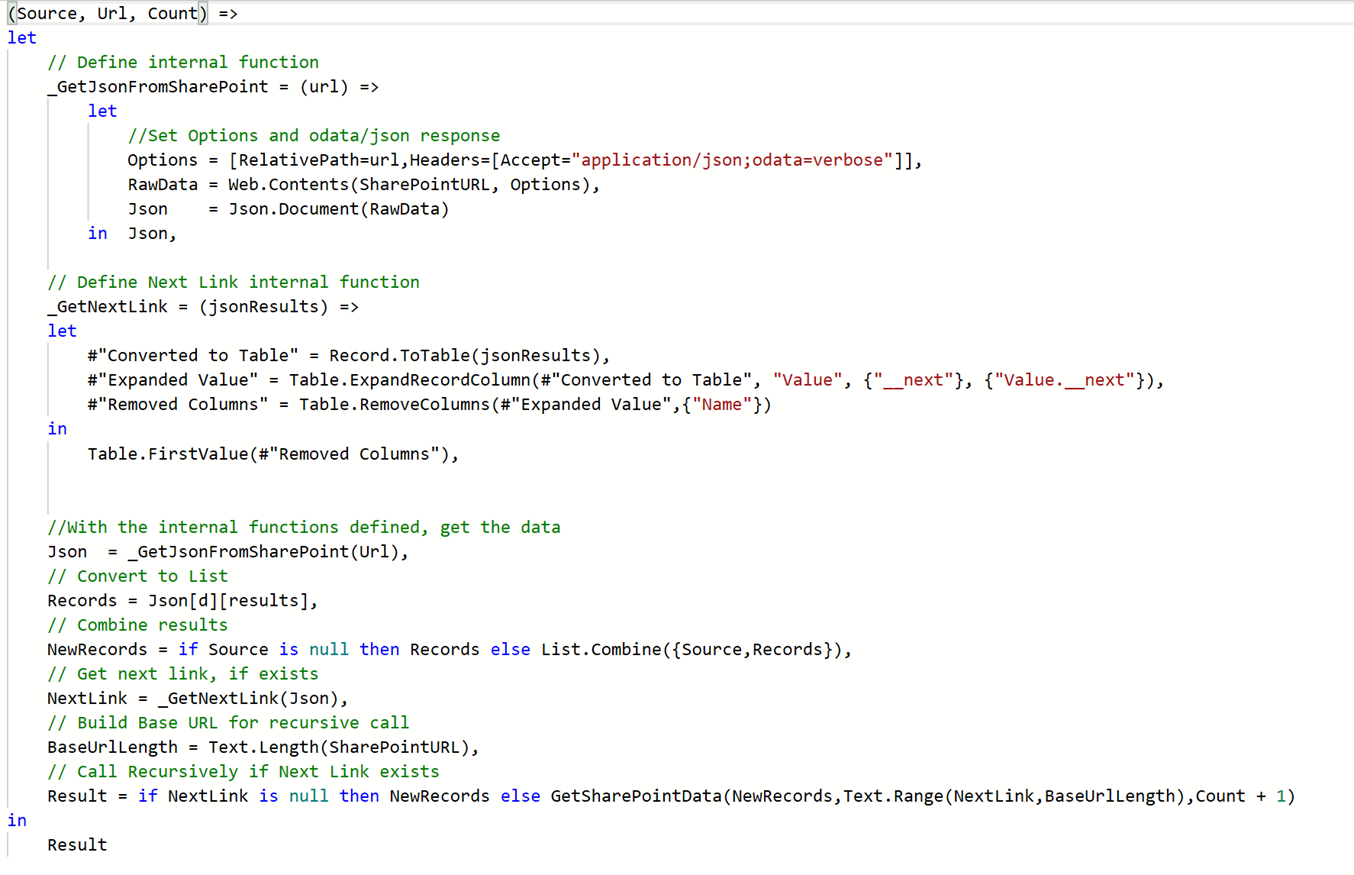
Figure 4 – Bespoke Function
The custom function takes three parameters:
1) Source – seeded with null and will store SharePoint query results.
2) Url – the query string parameters using the OData protocol.
3) Count – seeded with a zero, I used this to debug the function because it uses recursion.
The custom function also contains two nested functions:
_GetJsonFromSharePoint – This function would query the SharePointURL (parameter) with the url parameter that contained the query string parameters
_GetNextLink – This function would extract the pagination link in order to retrieve the next set of SharePoint data.
The end of the function executes by recursively calling SharePoint for the initial, and any subsequent queries defined by the __next value in the SharePoint response. As the data (in JSON format) is retrieved, it is combined using the List.Combine function. The Result variable then contains a row of JSON for each list item in SharePoint, and that can be parsed by Power Query to produce a table like the other options.
Conclusion
I am interested to see if others could recreate and refine this test scenario. I have loaded the scripts, Power BI reports, and instructions to set up the test on GitHub.
- Am I missing an option?
- Did I make a mistake with how I set up a Power BI Report test?
- Should I reconsider my relationship with SharePoint?
I would really like to hear your feedback, so let me know what you think on LinkedIn or Twitter.