How DataOps is woven into the Microsoft Fabric
Last week, there was a wave of awesome news that has come from the unveiling of Microsoft Fabric at Microsoft Build. Since that time, I’ve had a chance to initially review several of the new features and tools through the perspective of DataOps. As I explain to my colleagues and attendees of my DataOps 101 session, it’s very important to learn the principles of DataOps and how to apply them so that when you are presented with a brand-new product (like Fabric), you’ve got a solid foundation to succeed. Principles persist while tools transform over time, so learning the principles helps you be prepared for the changes in tooling that will inevitably occur.
I have a few favorite principles that I recommend focusing on when adopting DataOps, so the rest of this article provides a review of how I think each could be applied to Microsoft Fabric. Please note that I am reviewing a product currently in Preview, so what I say at the time of this article’s posting may have changed. Also, I will point out that since I first saw Microsoft documentation mention DataOps a little over 3 years ago, they have made big strides in making the principles inherent in their data products. Fabric seems to be taking a step even further in the right the direction. Therefore, as you read my thoughts below consider any critiques as constructive criticism.
Make It Reproducible
Make it reproducible: Reproducible results are required and therefore we version everything: data, low-level hardware and software configurations, and the code and configuration specific to each tool in the toolchain.
This principle emphasizes version control, so when I saw the announcement for Git Integration built into the tool, I was ecstatic! Even more so, the interface was designed to blunt the learning curve involved with Git for the non-initiated. Git Integration only supports Power BI Datasets and Reports, so Dataflow 1.0 and the new 2.0 is going to have to wait along with the other artifacts (e.g., lakehouse, Notebooks, etc.). That gap should be closed by Quarter 4, 2023 as announced during Day 2 of the Launch Event. In the meantime, Part 22 of my series is an option for your dataflows.
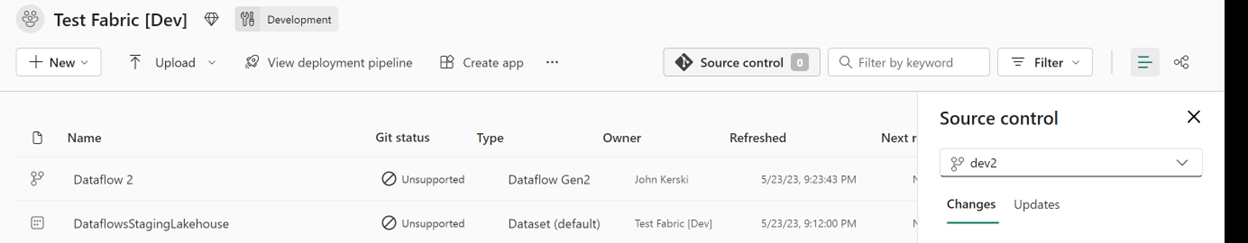
Figure 1 - You don’t know how long I’ve dreamt of this Git button appearing in a workspace.
For the datasets, Fabric saves the dataset not as a PBIX files (woo-hoo, no binaries) but rather in a text-based format which includes the .bim file. I hope to see an option for the TMDL format since seeing changes is much easier to pick out.
As for the Power BI reports, the format saved in Git is not as useful as the format pbi-tools offers. My hope is that a report version of TMDL becomes the default in the next year and we can move to an easier format to work with when doing pull requests, or just seeing what has changed (look at a Git Diff of a report JSON file in Figure 2 and you’ll understand).
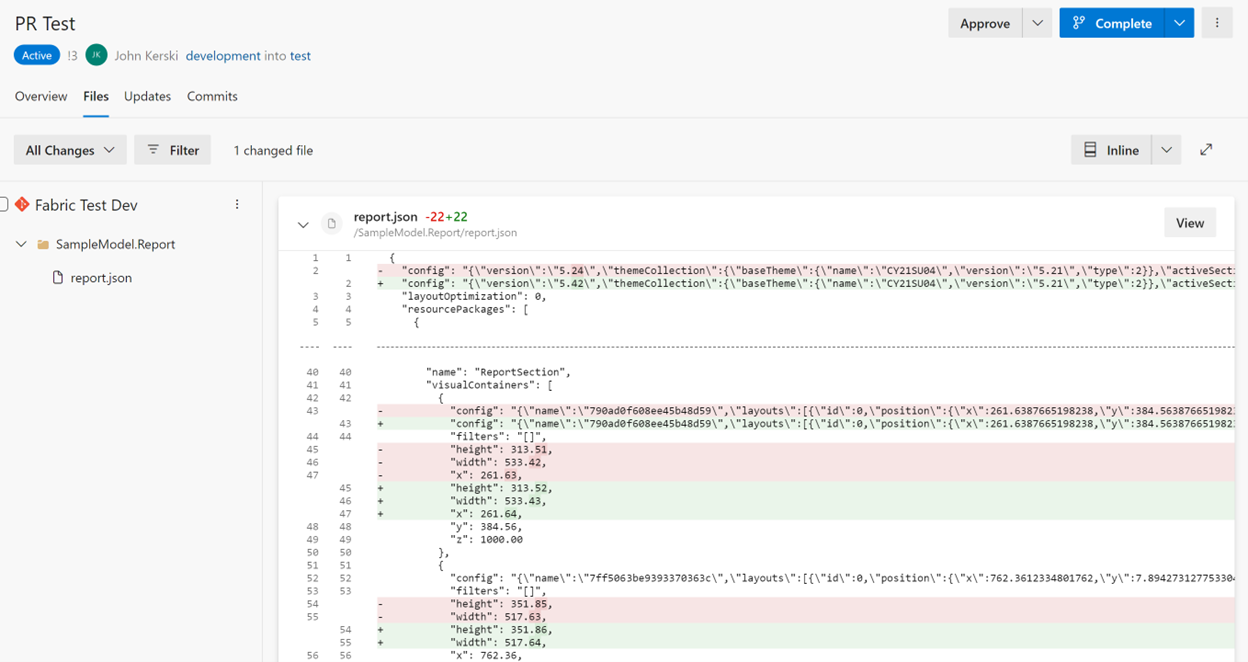
Figure 2 - We can do pull requests in Azure DevOps and see the changes! I would like pbi-tools format, but beggers can't be choosers!
Quality is Paramount
Analytic pipelines should be built with a foundation capable of automated detection of abnormalities and security issues in code, configuration, and data, and should provide continuous feedback to operators for error avoidance.
Test, test, and test. This principle stresses that the datasets, reports, dataflows, and the new artifacts in Fabric should have a level of testing. Are the columns in the right format (e.g., string, integer)? Should column match a Regex expression (e.g., email address, phone number) and does the number of rows output match expectations (e.g., a date dimension should have a date for today!)? These are all things that should be tested and automatically checked to serve as your safety net, so you avoid introducing errors in production.
At present, there isn’t a great framework native to Power BI or Fabric for instilling testing. We end up building bespoke solutions, whether that be Flávio Meneses or my own attempt. That said, I do see that Microsoft has opened the door for some huge opportunities:
1) With the introduction of Direct Lake (Sandeep Pawar does an awesome job explaining it), testing Dataflow Gen2 flows, Notebooks, and Pipeline inputs/outputs get that much easier. Since you can query the data via XMLA because its accessible via the Direct Lake dataset, you can automate the testing of schema and content.
2) With access to the Spark engine and Python, you can leverage libraries like Great Expectations to test the quality of each stage of your data transformations. Figure 3 shows a small example of what can be done. I’ll have more on this in a later blog post, but you can read Data Quality Unit Tests in PySpark Using Great Expecations for now.
3) With the introduction of Synapse Data Warehouse and its seamless integration with T-SQL, you can also build test scripts to automate the testing of schema and content.
4) Semantic Link is the one I’m most excited about. With the ability to query Power BI datasets from Python/Spark, detecting data quality issues and other issues appears to be much easier.
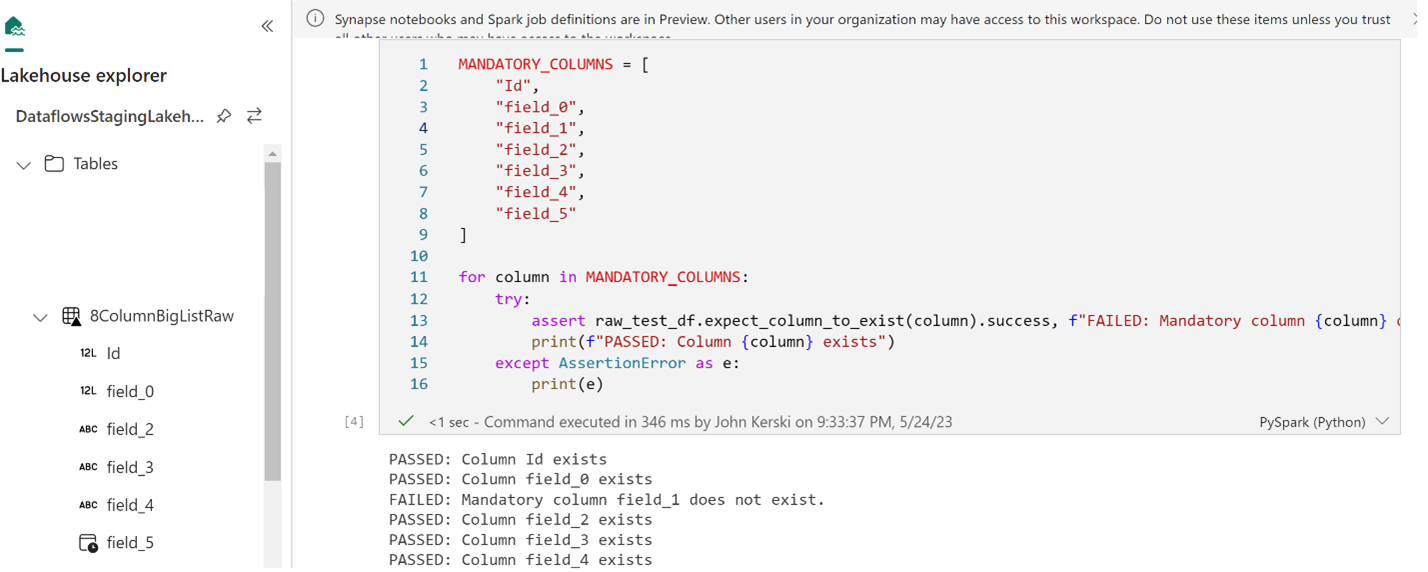
Figure 3 - Example of testing the quality of your data in Direct Lake using a Notebook.
With all the different options for testing, the issue won’t be whether you can test your data pipelines, it will be how to test your data pipelines. The consultant answer will be “it depends”, but deciding not to test will no longer be a reasonable choice (well done, Microsoft).
Monitor for Quality and Performance
Our goal is to have performance, security and quality measures that are monitored continuously to detect unexpected variation and generate operational statistics.
This principle identifies the importance of treating the data pipelines as a manufacturing line. For every step of the process we should be checking on the status, so you can catch errors before your customer do. While we’ve had to closely watch our emails for failures or use a monitoring solution, Microsoft appears to be moving closer to providing out-of-the-box monitoring:
1) Monitoring Hub – This is a station to view and track active activities across different products. For new Fabric artifacts, like Notebooks, you can get some very granular information on the health and details for each operation. For datasets and dataflows, the information is still quite high-level, and I hope for the ability to create your own issues based on conditions in the future.
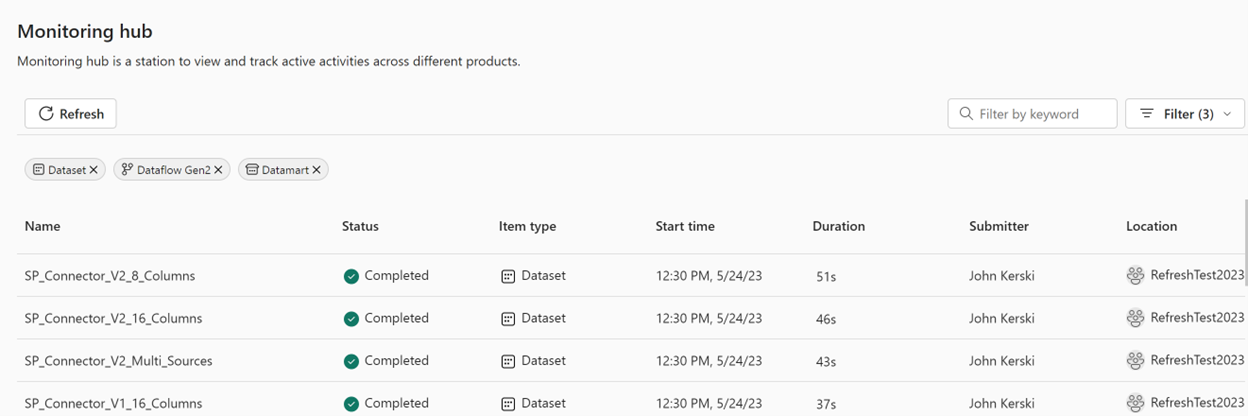
Figure 4 - The Monitoring Hub is a good start for reviewing the health of your data pipelines.
2) Data Activator – This is in preview at the moment and I’m waiting to see if I can get preview access, but it is identified to have the features of “Monitor data in Fabric, Power BI” and “Automate actions, alerts at scale”. I’m optimistic that this will empower people to perform data quality and performance testing through a low-code approach. And if it integrates with the aforementioned Monitoring Hub, the better!
Orchestrate
The beginning-to-end orchestration of data, tools, code, environments, and the analytic teams work is a key driver of analytic success.
Automating with Continuous Integration and Continuous Deployment (CI/CD) is key to getting analytics to our customers quicker while mitigating the risks of errors. Microsoft is facilitating the foundation for orchestration with the following:
1) Git Integration to Azure DevOps – Now we can more seamlessly kick off pipelines and as more artifacts are supported the more integration tests can be conducted.
2) Deployment Pipelines – Fabric artifacts cannot be promoted but this gap should be closed in Quarter 4, 2023. With more artifacts available to promote to test and production workspaces, it is becoming more important to address the lack of visibility to deployment rules for non-artifact owners. My hope is to see an API endpoint become available to see all the deployment rules so we can better manage the parameterization of our orchestration efforts, a critical concept to DataOps.
3) Fabric API – Much like what the Power BI REST APIs offered for orchestration, the pending API endpoints should provide us the ability to extend our orchestration in Azure pipelines. I’m waiting (impatiently) to see what Microsoft will offer in the coming months.
Reduce Heroism
As the pace and breadth of need for analytic insights ever increases, we believe analytic teams should strive to reduce heroism and create sustainable and scalable data analytic teams and processes.
In my own words, this means avoid burnout with you and your team. The litany of changes coming with Microsoft Fabric and Power BI can be overwhelming. You don’t need to know everything all at once, don’t be the hero. The feature is in preview with a 60-day trial now, so this is the time for prototyping and experimentation, not for building production-level products.
If you lead a data analytics team, my advice is to take the time to learn the fundamentals of Microsoft Fabric via the free Microsoft training available. Then empower others on your team to experiment with certain features, report back to the team on findings, and discuss ways these features can improve your productivity. If you are not sure how to parse out what features to investigate, Kurt Buhler offers a beautiful visual of the features here.
These are exciting times for embracing DataOps and Microsoft Fabric appears to be making that a practical reality.
I’d like to hear your thoughts, so please let me know what you think on LinkedIn or Twitter.
This article was edited by my colleague and senior technical writer, Kiley Williams Garrett.