Making Your Power BI Teams More Analytic with Microsoft Fabric - Real-time Intelligence
In the previous two articles, we set up saving test results to an Eventhouse in Fabric. Now let’s dive deeper into the Eventhouse and how we process the test data from PBIR Inspector, Tabular Editor 2, and Power Query Lint.
Figure 1 provides an overview of the processing within the Eventhouse, which implements a medallion approach. I used a Power BI Report with a Sankey Chart to illustrate the flow of test results (while not the ideal visualization, it’s more effective than the custom force-directed graph at the moment). For those unfamiliar with this nomenclature, the medallion architecture is a data design pattern for processing data through distinct layers: bronze (raw), silver (validated), and gold (ready for analytics). Microsoft describes it as providing “atomicity, consistency, isolation, and durability as data passes through multiple layers of validations and transformations before being stored in a layout optimized for efficient analytics.”
Figure 1: Eventhouse Medallion Architecture
As each testing tool produces its own format, we store the raw results in the bronze layer. In the silver layer, we need to transform and combine each test result to capture the following information in gold tables for analytics:
Tests - A distinct set of tests executed. As these three tools have different test definition files, we need to be able to generate a dimension so we can filter by a test or particular set of tests. This includes the description and the source of that test (e.g., PBIR Inspector).
Commits - A distinct set of information about what was committed (saved) to Git, including the report/semantic model name, the branch, and the repository. We do this because names can change over time, and we need to keep a history of what the information was at the time of commit.
Test Results - This is where we store the actual result of a test conducted. This would be considered our fact table. Note that the severity level is stored here as a test may be the same, but it may be considered a high severity issue for some semantic models and not for others.
Processing Test Results
But how do we get from bronze to gold? Eventhouse has the concept of an update policy. This update policy allows us to process a new row when it appears in bronze and save the results to another table (e.g., silver layer table). Update policies have some key features:
One Source Table, Many Update Policies - Multiple update policies can be defined on a single table. Therefore, with the bronze tables, we can save to multiple target tables: one needed for commit data transformation and one for test data transformation.
One Target Table, Many Sources - Update policies can support integrating multiple source tables. In this case, we need to append the test information from PBIR Inspector, Tabular Editor, and PQ Lint bronze tables to our silver table as one or more of them get new data. The syntax to set that up is cumbersome (mixing KQL and JSON), but here is an example:
// Example update policy code
.alter table tests_silver_combinded policy update
@'[{"Source": "pbir_inspector_tests_silver", "Query": "fnPBIRInspectorTestsToCombined()", "IsEnabled": true},
   {"Source": "pq_lint_tests_silver", "Query": "fnPQLintTestsToCombined()", "IsEnabled": true},
   {"Source": "tabular_editor_tests_silver", "Query": "fnTabularEditorToCombined()", "IsEnabled": true}]'
- Function-based - You may have noticed the “fn” prefix for three areas of the update policy above. These are functions that transform the data. They execute KQL to augment the new record in the source table and prepare it for the target table.
One of the reasons I chose this architecture is that update policies can do the ETL work without having to include another tool like Fabric Notebooks or Dataflows. This reduces the latency for getting results, which is going to be important for monitoring and branch policies, which will be covered in a later post.
Alright, as update policies and functions do the transformations and heavy lifting, we have one other key piece to cover: materialized views. We need to aggregate our data in a performant way so that for querying and reporting, we get results quickly. Materialized views accomplish that task, serving as the gold tables. For example, here is a materialized view for the tests dimension:
// Example materialized view for Tests dimension
.create-or-alter materialized view Tests on table
Tests
{
    tests_silver_combined
    | summarize by TestId, TestName, TestDescription, TestSource
    | order by TestId asc
}
Reacting to Real-Time Data
With all these components in place, we have a foundation to react to data as it appears. This can be accomplished in several ways:
- A Real-Time Dashboard - Eventhouses have built-in dashboarding capabilities, and while not as robust as Power BI, they are serviceable in my opinion.
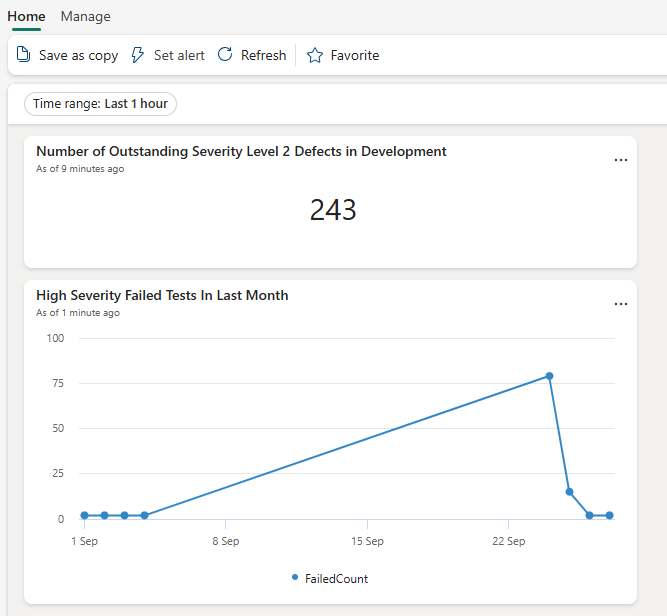 Figure 2: Real-Time Dashboard Example
- Fabric Data Agents - You can “<chat with your data” as this agent supports KQL databases (and Eventhouses fit into this category). These agents have APIs themselves, so you could integrate with other tools (e.g., Copilot, Teams) when issues with your tests arise.
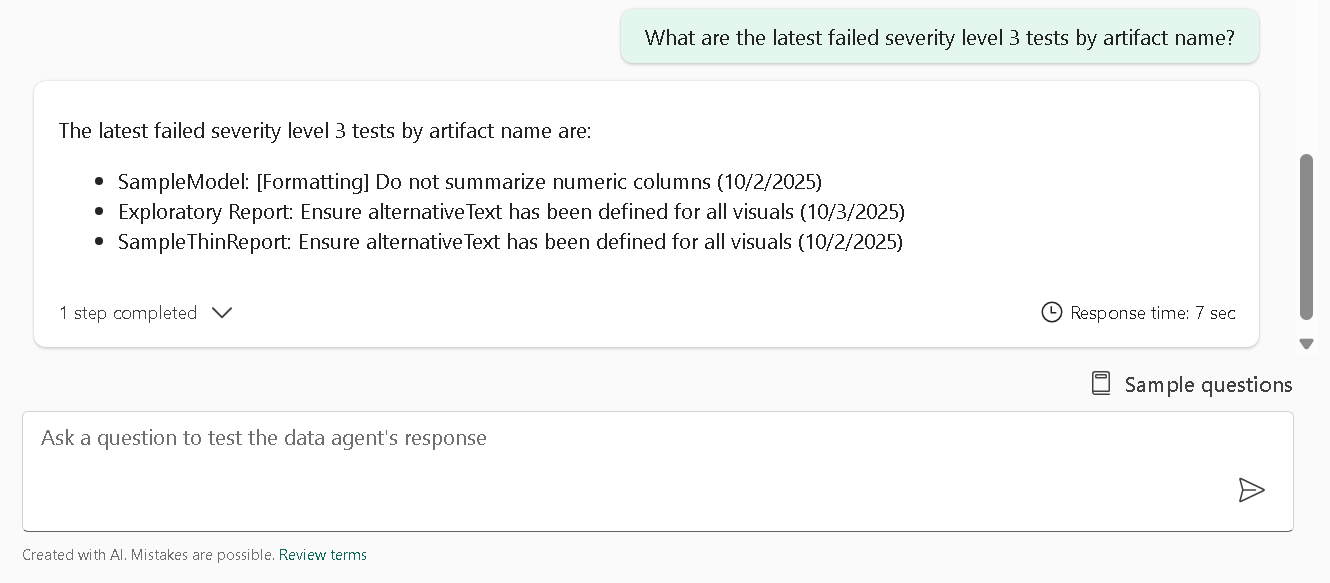 Figure 3: Fabric Data Agent Example
Data Activator - This allows you to create automated alerts and actions based on data patterns in your Eventhouse. You can set up triggers to notify teams when specific test failures occur or when certain thresholds are exceeded.
A Power BI Report - The classic approach to monitoring for issues. Eventhouse data can be ingested via the Azure Data Explorer connector. I’ll cover this in a later article.
A Branch Policy - Imagine a world where when someone wants to move a report update from development to production, they submit a Pull Request (a request to update the production branch), and it automatically checks the Eventhouse for major tests (those with a High Severity designation in the Test Results table) that have not failed?¹ And if there are failures, both you and the requester are notified? Would that save you time trying to build consistent and stable solutions?
Well, in the next post, I’ll walk through the branch policy approach.
As always, let me know your thoughts on LinkedIn or Twitter/X.
¹ You should be reading this in the voice of Don LaFontaine