Making Your Power BI Teams More Analytic with Microsoft Fabric - Static Analysis for Semantic Models
In my last article, I demonstrated how to test your Power BI Reports automatically using PBIR Inspector as they are committed to your repository. We can also test the semantic models for issues by inspecting the Tabular Model Definition Language (TMDL). TMDL provides a simpler way of defining Power BI Semantic Models. Unlike the JSON-based Tabular Model Scripting Language (TMSL), TMDL uses a more accessible tab-based format for specifying DAX measures, relationships, and Power Query code.
Consequently, we can leverage two tools to evaluate the model and the Power Query that defines much of the model’s creation: Tabular Editor 2 and Power Query Lint respectively. In full transparency, Power Query Lint is a tool we built at my company. You can read more about why we built it at this link.
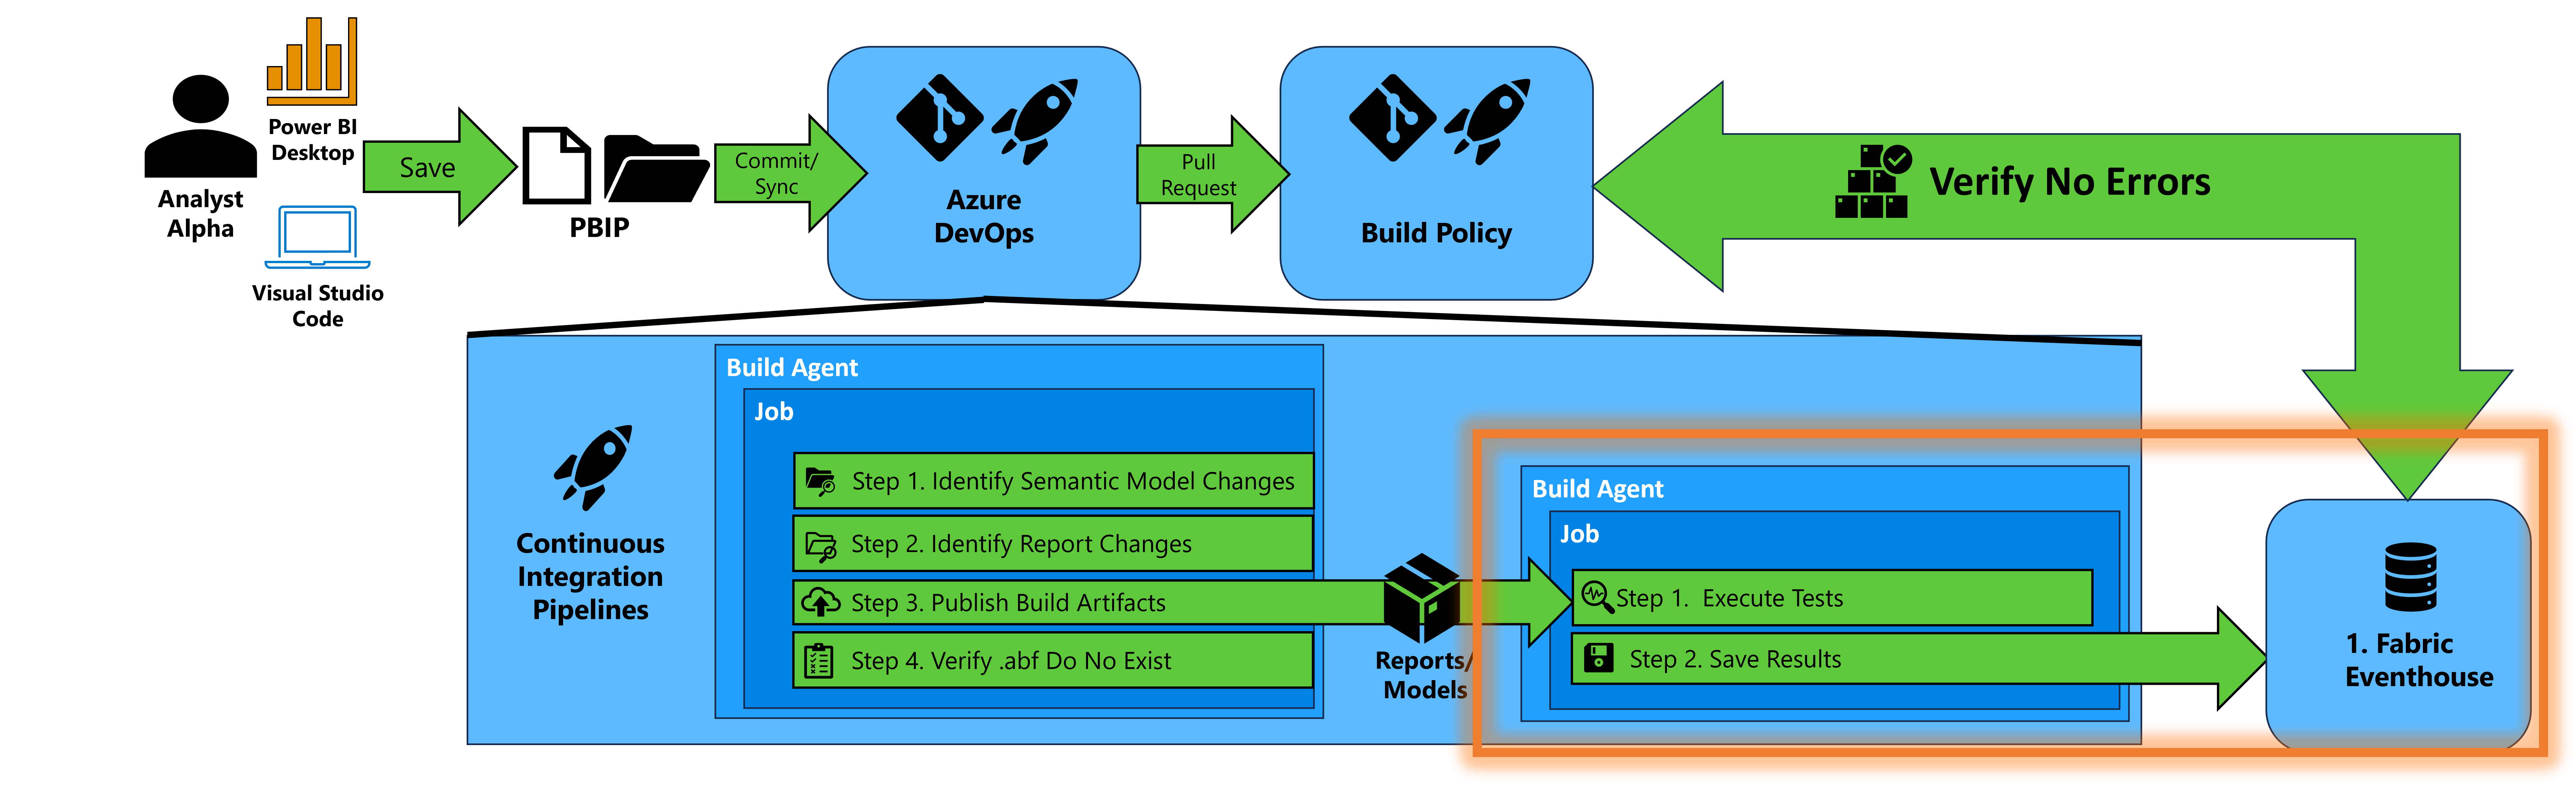 Figure 1 – High-level Diagram of analyzing semantic models with Tabular Editor 2 and Power Query Lint and storing results
As shown in Figure 1, we’ll focus on the lower-right and set up the technology to accomplish three key steps:
Analyzing semantic models with Tabular Editor 2 – Tabular Editor 2, developed by Daniel Otykier, examines the TMDL file format (which defines a Power BI semantic model) for issues based on predefined rules with a feature called the Best Practice Analyzer. It offers both a User Interface and a Command Line Interface (CLI). If you’re looking to standardize how your semantic models are built, this is a vital tool to apply rules and capture results. When you import the repository in the instructions below, you’ll import the Tabular Editor 2 executable and the predefined rules files. The rules file I have included is one I prefer to use for new projects. Feel free to update the rules file located in the “Rules” folder as you see fit.
Linting Power Query with Power Query Lint – Power Query Lint, developed by Luke Barker and me at Client First Technologies, examines the Power Query within the TMDL file for a set of predefined rules. The term “lint” is a term used in software development to describe tools that analyze code for errors, issues, and adherence to standards. We realized we needed a linting tool to help us improve our Power Query work across Excel, Power BI Desktop, and Dataflows. It allows us to identify and fix issues sooner rather than later. This tool has dramatically improved our newer team members’ understanding of Power Query and has helped keep me and more senior staff aligned with good practices. The rules are evaluated via an API, so when you import the repository in the instructions below, you’ll import the code that accesses the API. For these instructions, we’ll cover the free version of the API which is limited to roughly 30 rules, but we also offer a paid version that opens access to the complete set of rules.
Storing the analysis results – To track improvements over time, we need a place to store our results, aggregate analyses, and generate metrics. Just like we did with PBIR Inspector, we’ll save the metrics to the Eventhouse we created. Eventhouses are part of the Real-Time Analytics component of Microsoft Fabric and fit perfectly with our need to log test results quickly and allow for near real-time actions (e.g., like knowing when a critical test fails before your customer is impacted).
Choices
The instructions below will walk you through setting up a pipeline that will run Tabular Editor 2’s Best Practice Analyzer and instructions that walk you through setting up a pipeline that will run Power Query Lint. We keep two separate pipelines for three reasons:
- The format of the test results, XML for Tabular Editor and JSON for Power Query Lint, requires saving to the Eventhouse in different KQL tables.
- Separate pipelines that operate independently allow us to scale easier if you choose to add more build agents in Azure DevOps.
- We want to empower you to make the decision on what tools you want to use by keeping each tool in a separate pipeline. I know I’m biased with Power Query Lint, but you may choose not to use our tool.
Now let’s walk through the setup in the sections below.
Prerequisites:
If you completed the setup in the prior article, these prerequisites are handled, but it’s worth repeating:
You can create a Fabric Workspace. Instructions are provided at this link.
You have a service principal. If you are using a service principal, you will need to make sure the Power BI tenant allows service principals to use the Fabric APIs. The service principal will need at least the Member role to the workspace.
Set up Tabular Editor 2 - Best Practice Analyzer Pipeline
1. Set up Pipeline
Now we can set up the pipeline to run Tabular Editor 2’s Best Practice Analyzer in Azure DevOps when artifacts are published.
- Navigate to the Pipelines screen.
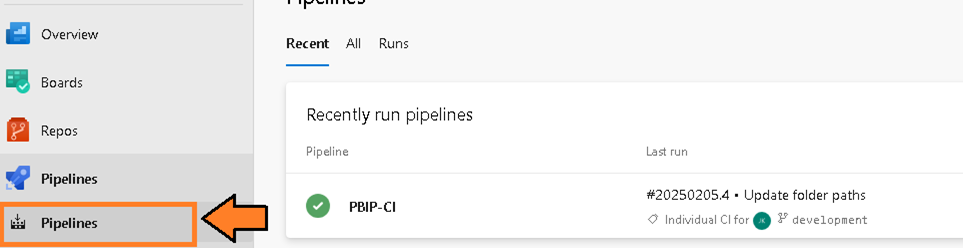 Figure 2 – Navigate to the Pipelines screen
 - Then select the “New Pipeline” button.
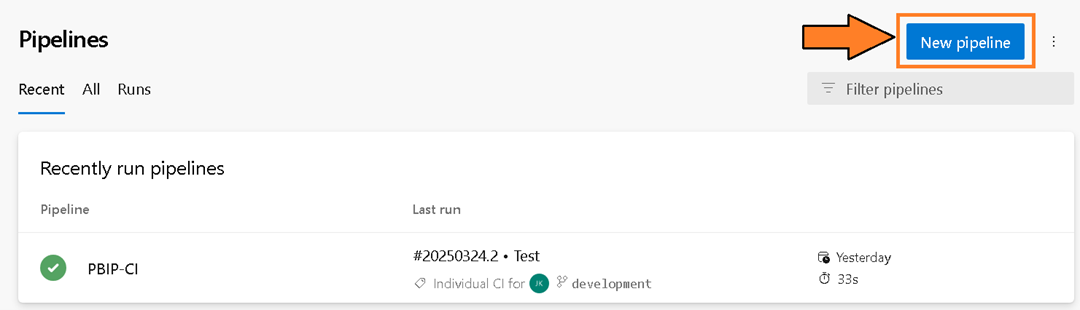 Figure 3 – Select the “New pipeline” button
 - You will be presented with the question “Where is your code?”. Select the Azure Repos Git option.
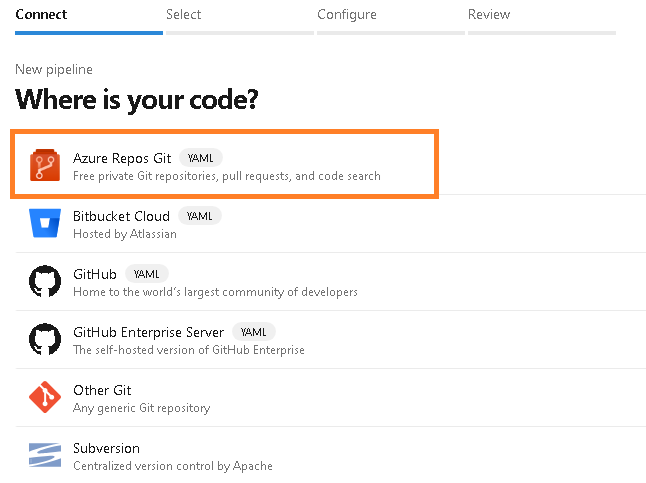 Figure 4 – Select the Azure Repos Git option
 - You will be prompted to select a repository. Select the repository name “pbi-teams-more-analytic-support”.
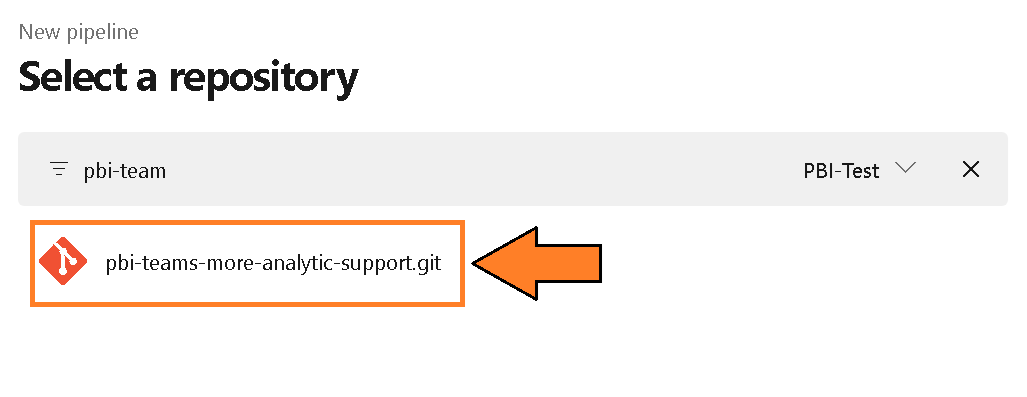 Figure 5 – Select a repository
 - You will be prompted to configure your pipeline. Choose the “Existing Azure Pipelines YAML file” option.
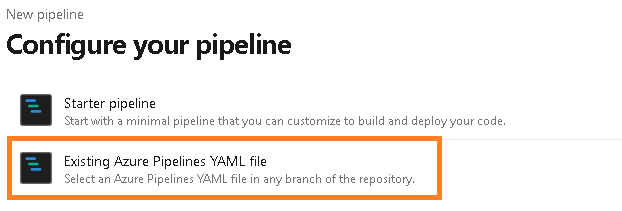 Figure 6 – Configure your pipeline
 - From the “Select an existing YAML file” select the Branch “eventhouse” and the Path named “tabular-editor-2-eventhouse.yml”. Press Continue.
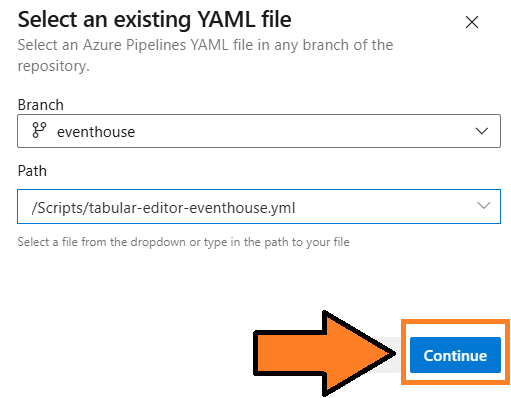 Figure 7 – Select tabular-editor-2-eventhouse.yml
 - Update the project names (line 32 and 84) to reference the project name.
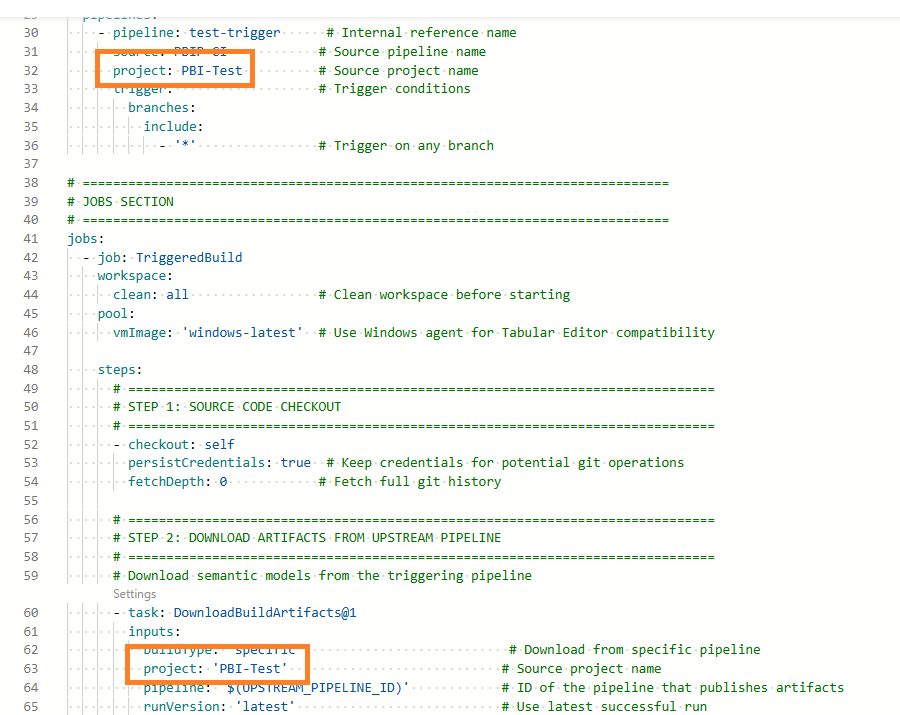 Figure 8 – Update project references
 - Then select the “Run” button and this will kick off the pipeline.
 Figure 9 – Select “Run” Button
 - You will be redirected to the pipeline screen and prompted to verify permissions. This is because the variable group is a resource that requires explicit access for the pipeline. This security measure (a good one) prevents inadvertent access to variables in the group. Click View to proceed.
 Figure 10 – Select the “View” button
 - You will be asked to permit the pipeline to access the variable group you created in the prior steps. Select the “Permit” button.
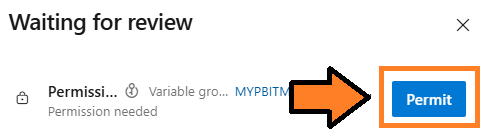 Figure 11 – Select the “Permit” button
 - You may be prompted again to permit. Select the “Permit” button.
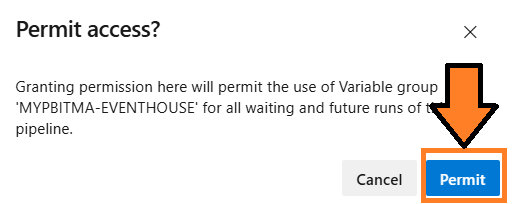 Figure 12 – Select the “Permit” button again
 - This will officially kick off the pipeline and it will access the last published packages from the PBIP-CI pipeline.
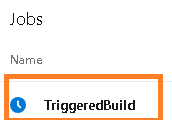 Figure 13 – Pipeline trigger
 - When the pipeline completes, verify there are no errors, and you can check the Eventhouse to see if Tabular Editor 2’s Best Practice Analyzer results have been saved to the bronze table.
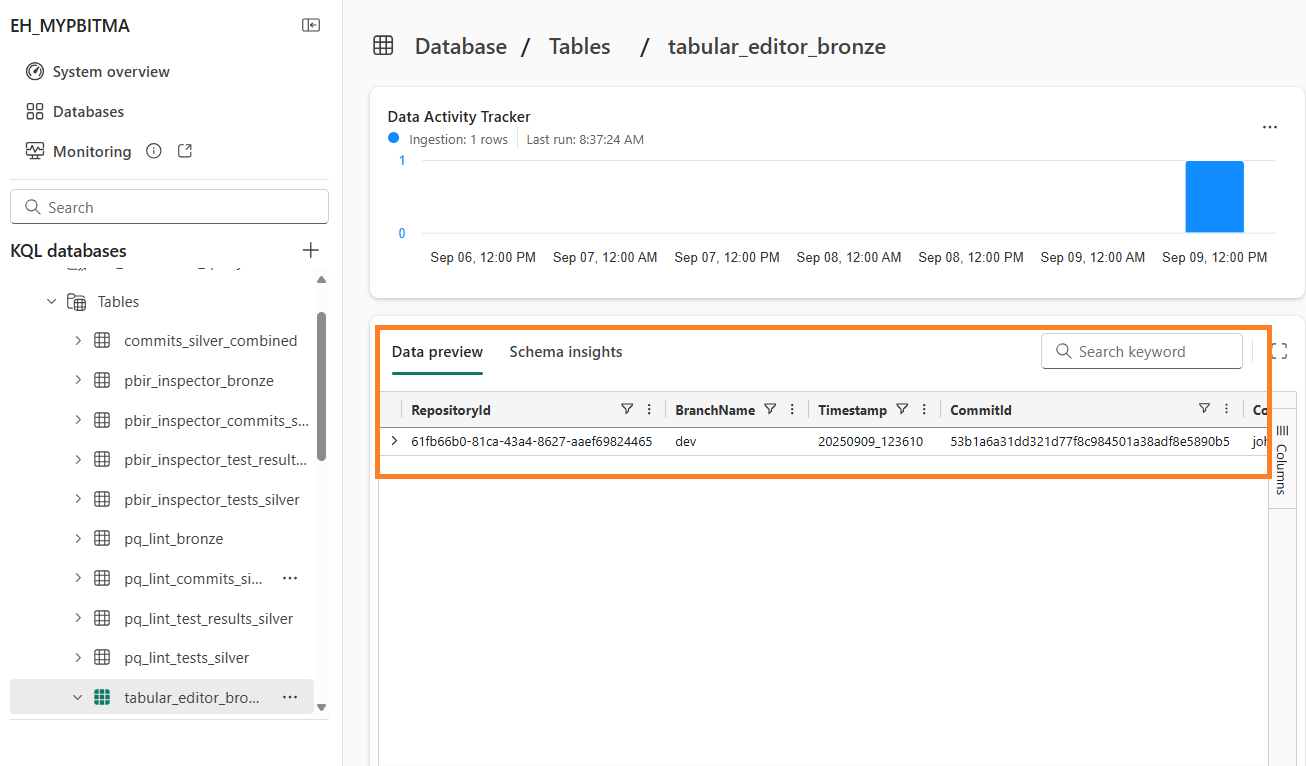 Figure 14 – Example of files saved to Eventhouse
 - I would recommend renaming the pipeline from the default to “tabular-editor-2-bpa”. Instructions for renaming a pipeline can be found at this link.
Set up Power Query Lint
1. Set up Power Query Lint Account
Before setting up the pipeline, you’ll need to create a free account at Power Query Lint to access the API.
Navigate to Power Query Lint and select “Microsoft Login”.
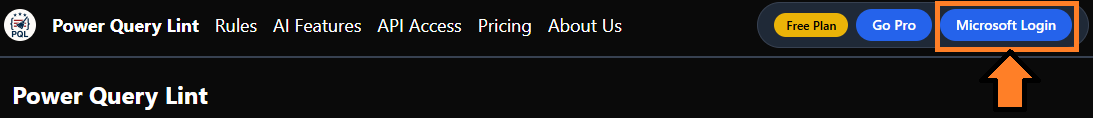 Figure 15 – Login to Power Query Lint
Complete the sign-in process with your Microsoft account and verify your email address.
Once logged in, navigate to the API Access link.
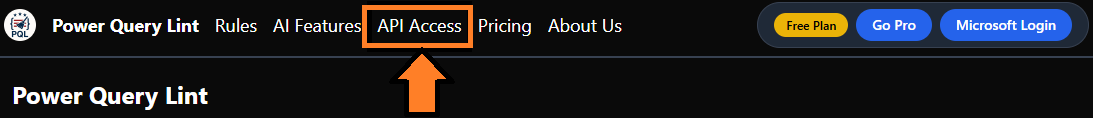 Figure 16 – Navigate to API Access
Select the “Create API Subscription” button. This will generate an API key associated with your account.
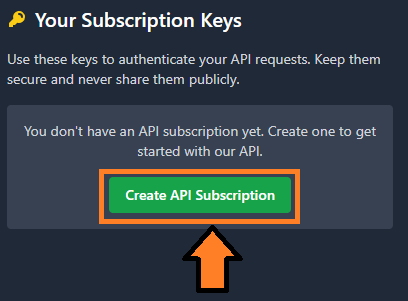 Figure 17 – Create API Subscription
Copy the API key as you’ll need it for the variable group configuration.
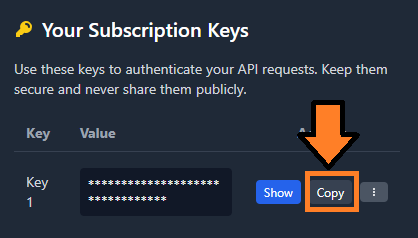 Figure 18 – Copy API Key
2. Update Variable Group
We need to add the Power Query Lint API key to our existing variable group.
In your Azure DevOps project, navigate to the Pipelines->Library section.
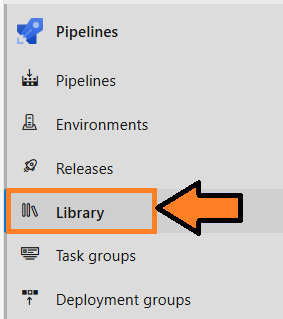 Figure 19 – Select Library
- Select the “MYPBITMA-EVENTHOUSE” variable group you created previously.
- Add a new variable:
PQLINT_SUBSCRIPTION_KEY – This is your Power Query Lint API key. Set the lock icon so it’s encrypted and not visible in plain text.
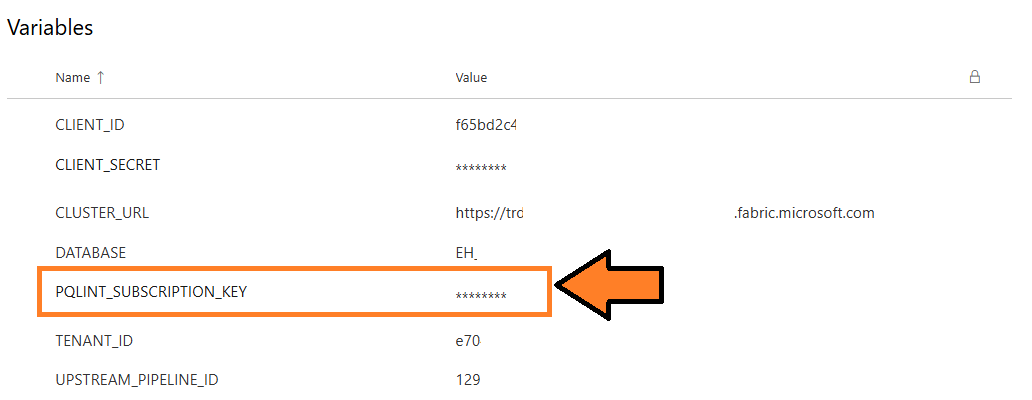 Figure 20 – Save PQLINT_SUBSCRIPTION_KEY variable
- Save your changes.
3. Set up Pipeline
Now we can set up the pipeline to run the Power Query Lint tool in Azure DevOps when artifacts are published.
- Navigate to the Pipelines screen. Figure 21 – Navigate to the Pipelines screen
- Then select the “New Pipeline” button. Figure 22 – Select the “New pipeline” button
- You will be presented with the question “Where is your code?”. Select the Azure Repos Git option. Figure 23 – Select the Azure Repos Git option
- You will be prompted to select a repository. Select the repository name “pbi-teams-more-analytic-support”. Figure 24 – Select a repository
- You will be prompted to configure your pipeline. Choose the “Existing Azure Pipelines YAML file” option. Figure 25 – Configure your pipeline
- From the “Select an existing YAML file” select the Branch “eventhouse” and the Path named “pq-lint-eventhouse.yml”. Press Continue.
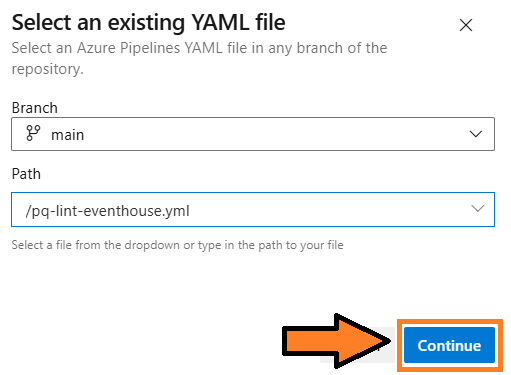 Figure 26 – Select pq-lint-eventhouse.yml
 - Update the project names (line 32 and 66) to reference the project name.
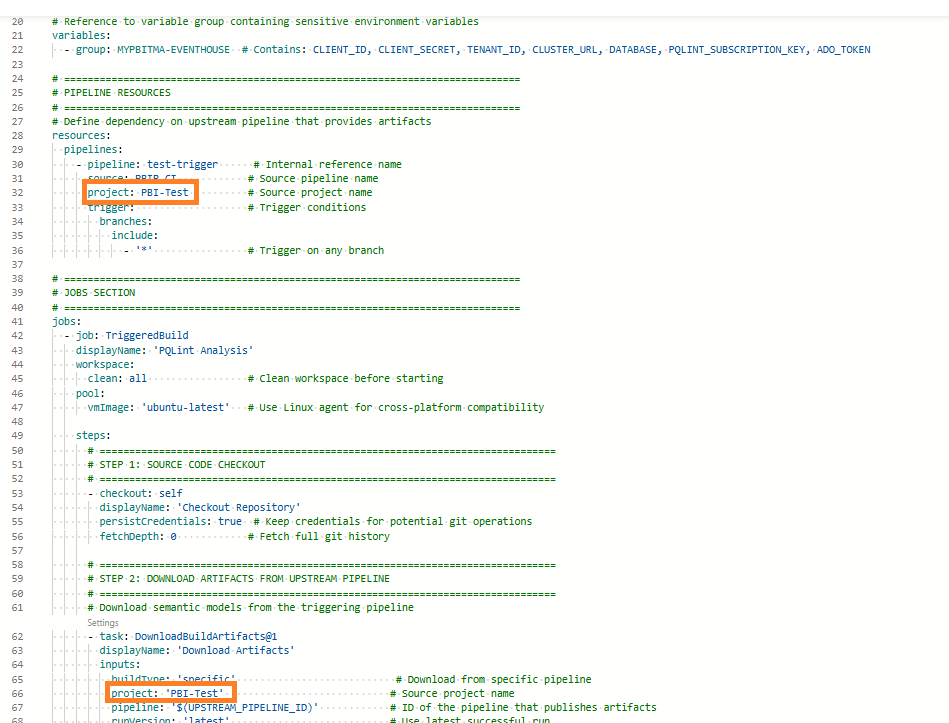 Figure 27 – Update project references
 - Then select the “Run” button and this will kick off the pipeline. Figure 28 – Select “Run” Button
- You will be redirected to the pipeline screen and prompted to verify permissions. This is because the variable group is a resource that requires explicit access for the pipeline. This security measure (a good one) prevents inadvertent access to variables in the group. Click View to proceed. Figure 29 – Select the “View” button
- You will be asked to permit the pipeline to access the variable group you created in the prior steps. Select the “Permit” button. Figure 30 – Select the “Permit” button
- You may be prompted again to permit. Select the “Permit” button. Figure 31 – Select the “Permit” button again
- This will officially kick off the pipeline and it will access the last published packages from the PBIP-CI pipeline. Figure 32 – Pipeline trigger
- When the pipeline completes, verify there are no errors, and you can check the Eventhouse to see if Power Query Lint results have been saved to the bronze table.
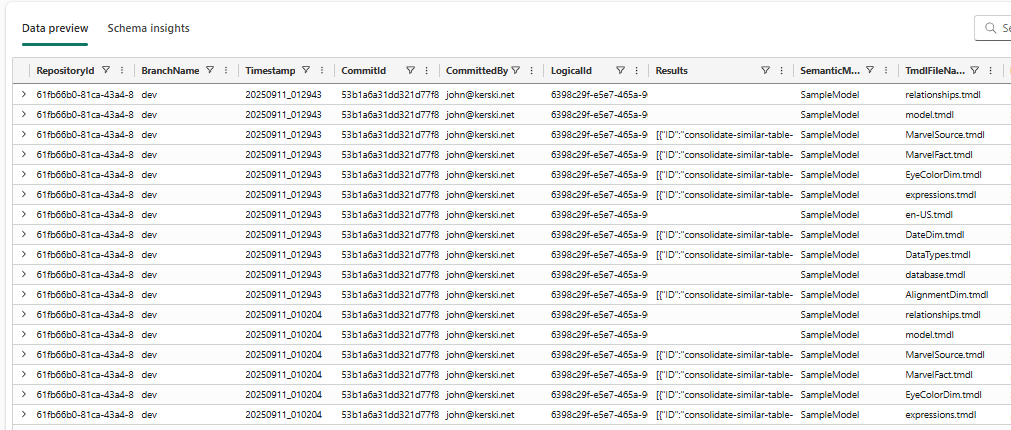 Figure 33 – Example of files saved to Eventhouse
 - I would recommend renaming the pipeline from the default to “pqlint”. Instructions for renaming a pipeline can be found at this link.
Potential Issues
If you see errors in your pipeline, verify that your service principal has Member rights to the workspace and also verify that the Query URI for the Eventhouse is correct. I have also seen that if you recently created the Eventhouse, you may get a 520 HTTP error in the pipeline. Re-run the pipeline again and the data should be saved (it seems like you have to ‘prime’ the pipeline).
Also, tests will only run on semantic model changes. If you’re making changes to the report (visuals), this pipeline will not save any test results because no tests will be executed.
Conclusion
Hopefully, this guide helped you successfully set up both Tabular Editor 2’s Best Practice Analyzer and Power Query Lint to analyze your semantic models. With these tools in place, you now have great coverage for testing both your Power BI reports and semantic models. The combination of PBIR Inspector, Tabular Editor 2, and Power Query Lint provides a robust foundation for maintaining code quality across your Power BI development lifecycle.
As always, let me know your thoughts on LinkedIn or Twitter/X.