DataOps Principle #14 - Analytics is manufacturing
Exciting developments are underway for Microsoft users, with the recent announcements of Power BI Desktop Developer Mode in public preview and Fabric’s roadmap for Git repository integration within Azure DevOps. These advancements empower developers with increased flexibility in managing their dataflows, datasets, notebooks, and other workspace artifacts directly within the Fabric workspace.
As I’ve discussed in past articles (Part 22 and Part 25), integrating source code with Azure DevOps yields significant benefits, including the ability to trigger pipelines for evaluating, testing, and deploying code to Power BI workspaces. This integration streamlines development and deployment processes, enhancing collaboration and version control for Power BI projects.
However, as Git integration moves into general availability and more developers begin using Azure DevOps pipelines, monitoring becomes a greater priority.
In DataOps, Analytics is Manufacturing:
Analytic pipelines are analogous to lean manufacturing lines. We believe a fundamental concept of DataOps is a focus on process-thinking aimed at achieving continuous efficiencies in the manufacture of analytic insight.
When applied to Power BI projects, this means that whether you are building dataflows to transform data and load it into a data lake or automating the deployment of a new dataset to a Power BI workspace with Azure DevOps, each pipeline is analogous to an assembly line that is creating a product for a customer. Therefore, if we are not actively monitoring our Azure DevOps pipelines, we introduce a weakness in our approach for delivering analytic products.
Many things can cause an Azure DevOps pipeline to fail. Here are just a few issues my teams watch for:
1) Build Agent Failures. A build agent is an operating system specifically configured to run your pipelines. If the configuration is broken, the build agent can’t run or execute the necessary pipeline steps.
2) Step Failures. Pipelines allow you to run custom PowerShell code, use secret variables (e.g., passwords), add extensions, and more. A bug in code, an expired password, or a misconfigured extension could lead to the failure of the pipeline build.
3) Network Failures. Pipelines need to communicate with services like Azure Active Directory (is that called Entra now?) and Power BI. If the network connection fails or becomes degraded, it may cause your pipelines to fail.
4) Schedule Failures. You can schedule builds to run regularly, as defined in YAML. However, it has been my experience that Azure DevOps conveniently forgets that schedule (it’s not a human, but I will anthropomorphize as I wish). When pipelines don’t run as scheduled, you don’t get a notification about the failure. A missed schedule failure can create confusion and frustration for your teams and customers.
These issues can disrupt the analytics manufacturing line and impede the testing and deployment of Power BI artifacts. So, how do we monitor them?
The Problem with Monitoring Azure DevOps Pipelines
Alright, well, Azure DevOps is a Microsoft product. Surely, they have a native connector to get pipeline data.
If you search for Azure DevOps in the Get Data Power BI navigator pane, you’ll see you can only import Azure Board data. Only… board… data… oh man.
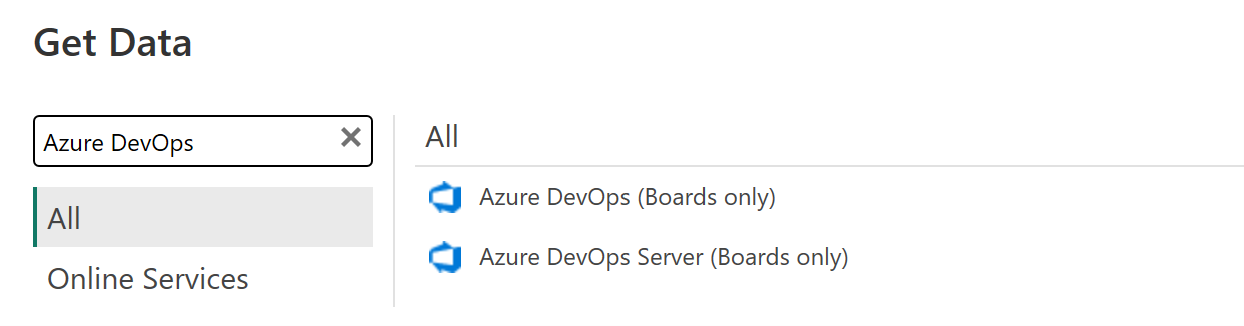 Figure 1 - The native options for importing Azure DevOps data… Boards only
A Potential Solution
Faced with a lack of a connector, I broke out the trusty Web.Contents function and began building Power Query code to query the pipeline application programming interfaces (APIs) in a Gen1 dataflow, and integrate it with the existing pbi-dataops-monitoring template. Why a Gen1 dataflow? Well, I want to be prepared to monitor these issues when Fabric becomes generally available. When it does, our projects with Fabric can easily upgrade to Gen2 Dataflows and export the results to a data lake. Leveraging Direct Lake datasets will enable us to quickly identify and address issues. At the same time, using a Gen1 Dataflow ensures I can continue monitoring in Pro or Premium Per User (PPU) environments, providing the best of both worlds.
Implementation
Figure 2 provides a screenshot of the queries found within the Gen1 Dataflow, demonstrating the components of its structure:
Parameter
- PipelineIssueID & FailedScheduledPipelineIssueID: The unique identifier used in the "Issues Table" in the pbi-dataops-monitoring template.
- AzureDevOpsBaseURL: The URL to the project hosting your Azure pipelines.
Functions
- fnGetPipelinesInProject: This custom function serves as a wrapper for the Pipelines -- List endpoint.
- fnGetPipelineRunsInProject: This custom function serves as a wrapper for the Pipelines -- Runs endpoint.
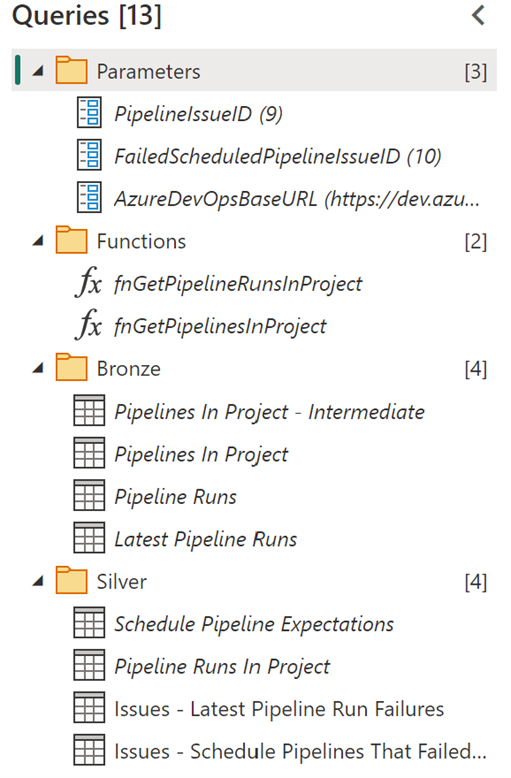 Figure 2 - Queries found in the Gen1 Dataflow
Bronze
- Pipelines In Projects -- Intermediate: This table calls the "fnGetPipelinesInProject" function used in other bronze group tables.
- Pipelines In Project: This table contains all pipelines associated with the project.
- Pipelines Runs: This table calls the "fnGetPipelineRunsInProject" function and returns the history of available pipeline runs.
- Latest Pipeline Runs: This table identifies the latest run for each pipeline in the project.
Silver
- Schedule Pipeline Expectations: This table enables us to set expectations for the frequency of pipeline runs. You can simply edit the source table, add the Pipeline ID (found in "PipelinesInProject"), and set the threshold for the number of hours that can pass before an issue is raised.
- Pipeline Runs in Project: This table combines the results of the bronze group and represents a curated overview of pipeline runs.
- Issues - Latest Pipeline Run Failures: This table combines the results from the bronze group and flags any pipelines where the latest iteration failed.
- Issues -- Schedule Pipelines That Failed to Run as Scheduled: This table combines the results from the bronze group and the "Schedule Pipeline Expectations" table, flagging any scheduled pipelines that failed to meet expectations.
These tables are already formatted for integration with the pbi-dataops-monitoring template. Just add the tables as instructed here, and you’re all set.
Do you want to try the dataflow for your Azure DevOps project? I’ve got a setup script that will install a template flow and create the Personal Access Token so you can authenticate the connection to Azure DevOps in your dataflow.
Side Note on Personal Access Tokens
If you just read “personal access token” and thought, “What happens if that expires? This could break, and I won’t be able to monitor my dataflows,” you’re already thinking with DataOps principles in mind! As the service principal authentication becomes generally available, we may see new and improved authentication options. In the meantime, proactively schedule reminders for updating tokens to avoid monitoring disruptions.
Conclusion
The increasing adoption of Azure Pipelines with Git Integration in Power BI is exciting, prioritize monitoring these pipelines. Try the Gen1 dataflow template I have shared on GitHub to get started.
I’d like to hear your thoughts, so please let me know what you think on LinkedIn or Twitter or YouTube.
This article was edited by my colleague and senior technical writer, Kiley Williams Garrett.